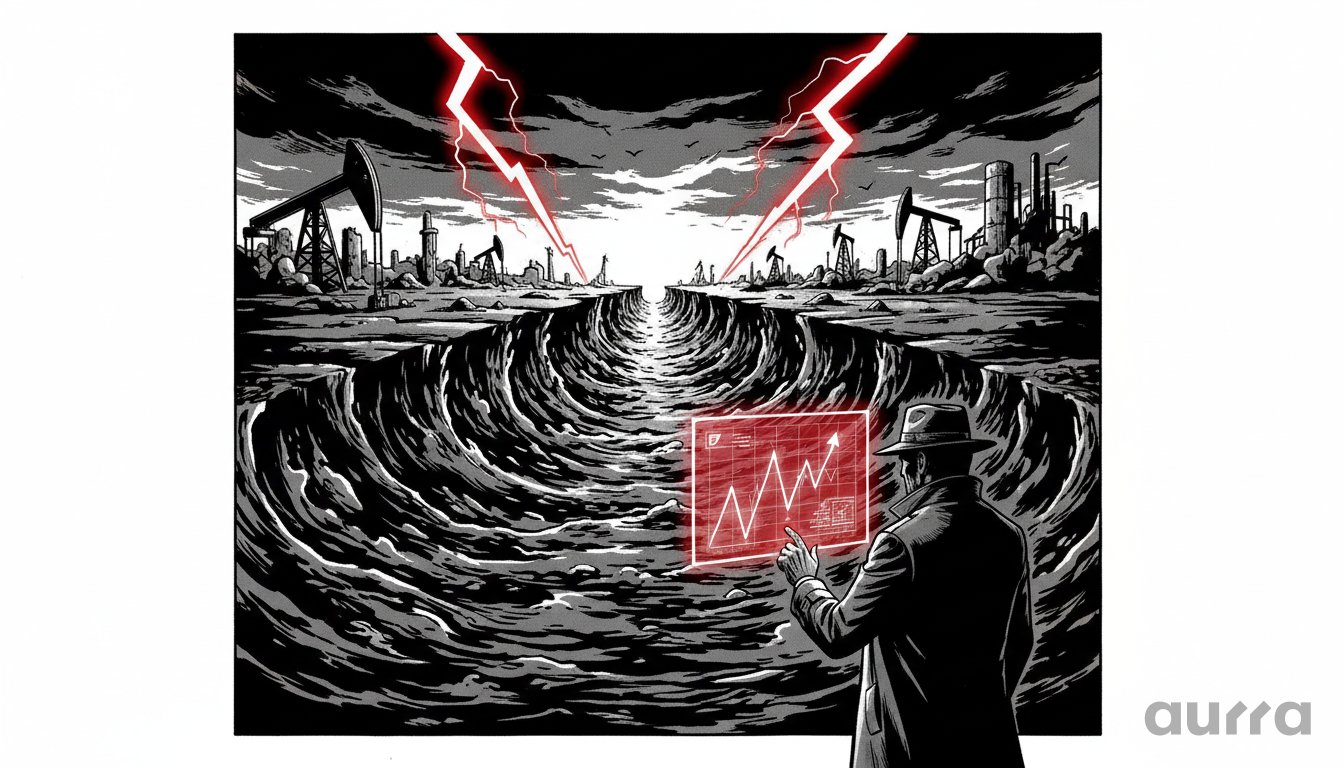
What is Fueling the Sharp Rally in WTI Crude Oil?
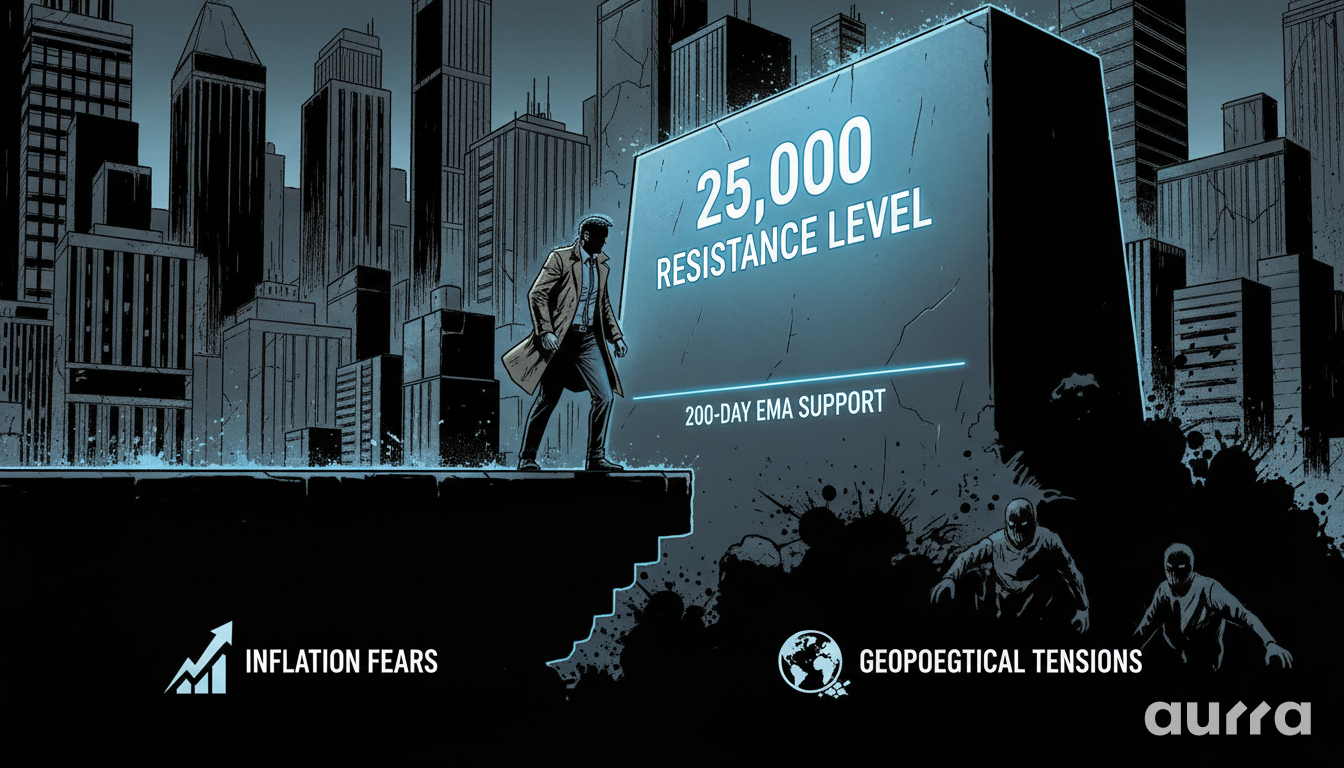
WTI Crude Oil prices have climbed to their highest level since last August, breaking the $67 mark in a rally fueled by a potent combination of fundamental and technical factors. The primary driver is a sharp escalation in geopolitical tensions between the United States and Iran, which introduces a significant risk premium to the market.
This is compounded by supportive inventory data and a series of bullish technical signals that are encouraging buyers. For traders, this environment underscores the importance of a multi-faceted analysis, where understanding both the news flow and the charts is paramount to identifying opportunities.
What Fundamental Factors Are Supporting Higher Oil Prices?
The fundamental landscape for crude oil has turned decisively bullish. The most significant factor is the heightened geopolitical risk in the Middle East, with the potential for military action threatening major supply arteries like the Strait of Hormuz. This headline-driven market is further supported by a surprise report from the Energy Information Administration (EIA), which noted a substantial 9-million-barrel drop in US inventories. This suggests that demand is outstripping supply, providing a solid, data-grounded reason for the price increase.
How Does Geopolitical Tension Impact Oil?
The threat of conflict creates immediate uncertainty about the stability of the global oil supply. Any disruption, or even the threat of one, can lead to rapid price spikes. During such volatile, news-driven events, the reliability of your trading platform is critical. Aurra Markets' commitment to 99.9% uptime ensures you have the stable and efficient environment needed to react to market-moving news without interruption.
Why is the EIA Report Significant?
The EIA inventory report is a critical piece of data for oil traders. A drawdown of 9 million barrels is substantially larger than typical fluctuations and signals strong demand. This helps to justify the price rally on a supply-demand basis, not just on speculation. Traders can stay ahead of this by using our Economic Calendar, which lists the release times for this and other key reports.
Trading is a digital experience, but trust is a human one. We believe you should know exactly who is handling your capital, where we are regulated and the vision driving our technology.
🤝 Meet the Team: We are building more than just a platform; we are building a legacy. Learn about our leadership, our regulatory standards, and our mission at About Us.
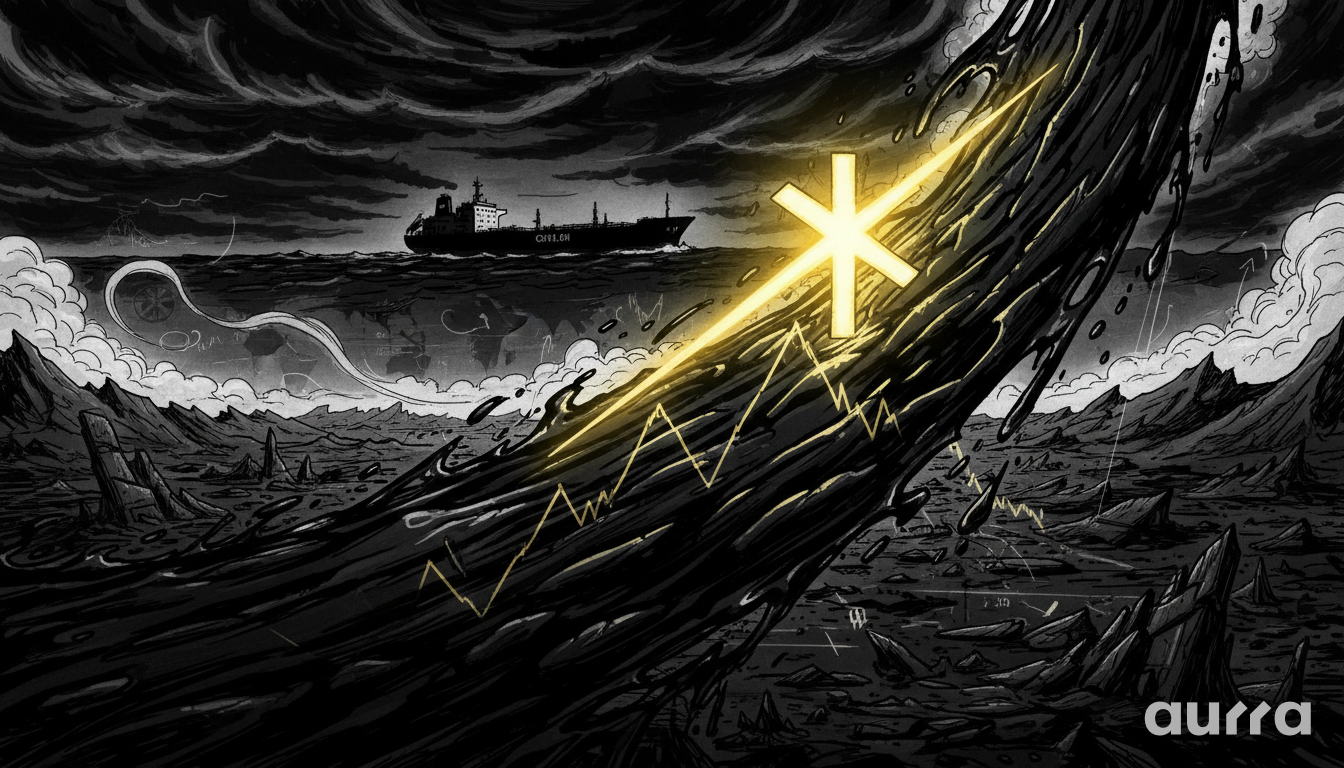
What Technical Signals Are Pointing to Further Gains?
The technical picture for WTI Crude Oil is reinforcing the bullish fundamental narrative. Two key patterns have emerged that are likely motivating technical traders. A clear double-bottom pattern formed at the $55.28 support level, a classic bullish reversal signal. More importantly, the market has witnessed a 'golden cross', where the 50-day moving average crosses above the 200-day moving average. This is widely regarded as a signal of a longer-term shift to a bullish trend.
What are the Key Price Levels to Watch?
The chart structure suggests that the path of least resistance is currently higher. The next major target for the bulls is the psychological resistance level at $70.00. However, traders should also identify the key support level that would invalidate the bullish outlook. A drop back below $62.00 would suggest that the current breakout has failed and could signal a return of bearish pressure. You can monitor these key moving averages and price levels in real-time on the MetaTrader 5 (MT5) platform.
In a market where every pip counts, your broker's infrastructure is your competitive advantage. Low spreads are a good start, but true performance comes from deep liquidity and reliable execution during high volatility.
🏆 See the Difference: Why do professional traders switch to Aurra? From our liquidity partners to our execution speeds, discover our full competitive edge at Why Choose Us.
Key Takeaways
- **WTI Crude Oil** has rallied to its highest price since last August, above $67 per barrel.
- The rally is driven by both escalating geopolitical tensions between the US and Iran and a significant 9-million-barrel drop in US oil inventories.
- Bullish technical patterns, including a double-bottom and a 'golden cross', are providing strong confirmation for the upward trend.
- The next key resistance level to watch is the psychological $70 mark, while a drop below $62 would invalidate the current bullish thesis.
The 'golden cross' is a powerful technical signal in the oil market right now. How much weight do you place on long-term technical patterns versus short-term news flow when trading commodities?
Trading in financial markets involves a high level of risk and may not be suitable for all investors. The value of investments can go down as well as up, and you may receive back less than your original investment. It is crucial to be aware of all the risks associated with trading and to seek advice from an independent financial advisor if you have any doubts. Past performance is not indicative of future results. All content is for informational and educational purposes only and should not be considered personal financial advice.
Aurra Global Markets Limited License Number:
GB25204837 (Financial Services Commission of Mauritius)
Infrastructure: MetaTrader 5 (MT5) | Institutional-Grade Liquidity | Native Crypto-Funding
The Standard: We are not just a broker; we are the infrastructure for the next generation of global traders.
🛡️ Security Verification:
You are trading with Aurra Markets International. We are a distinct, independent financial institution. We are not associated with 'Aura FX', 'Auro Markets', 'Aurora', or 'Aura Funded'. Always verify your URL: Ensure you are connected to the official www.aurra.markets