Why is the EUR/USD Bouncing and Can It Last?
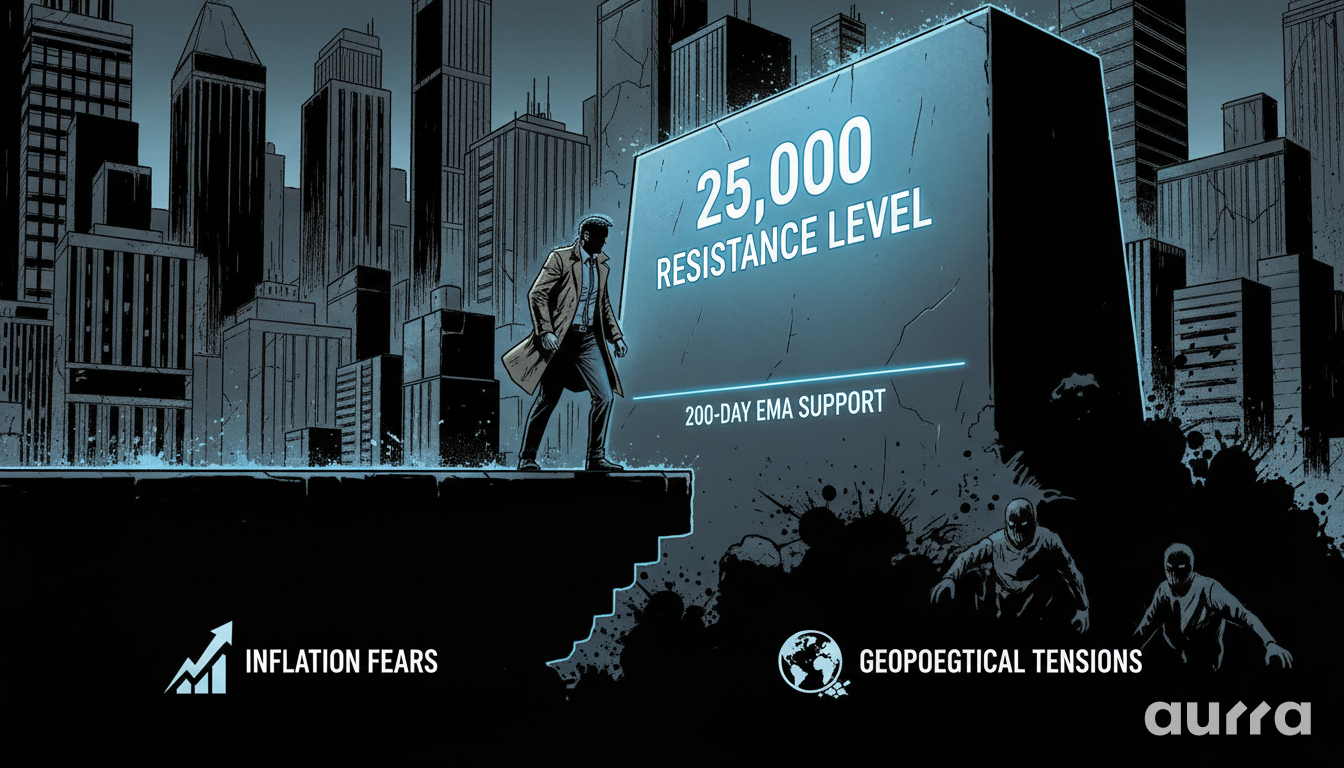
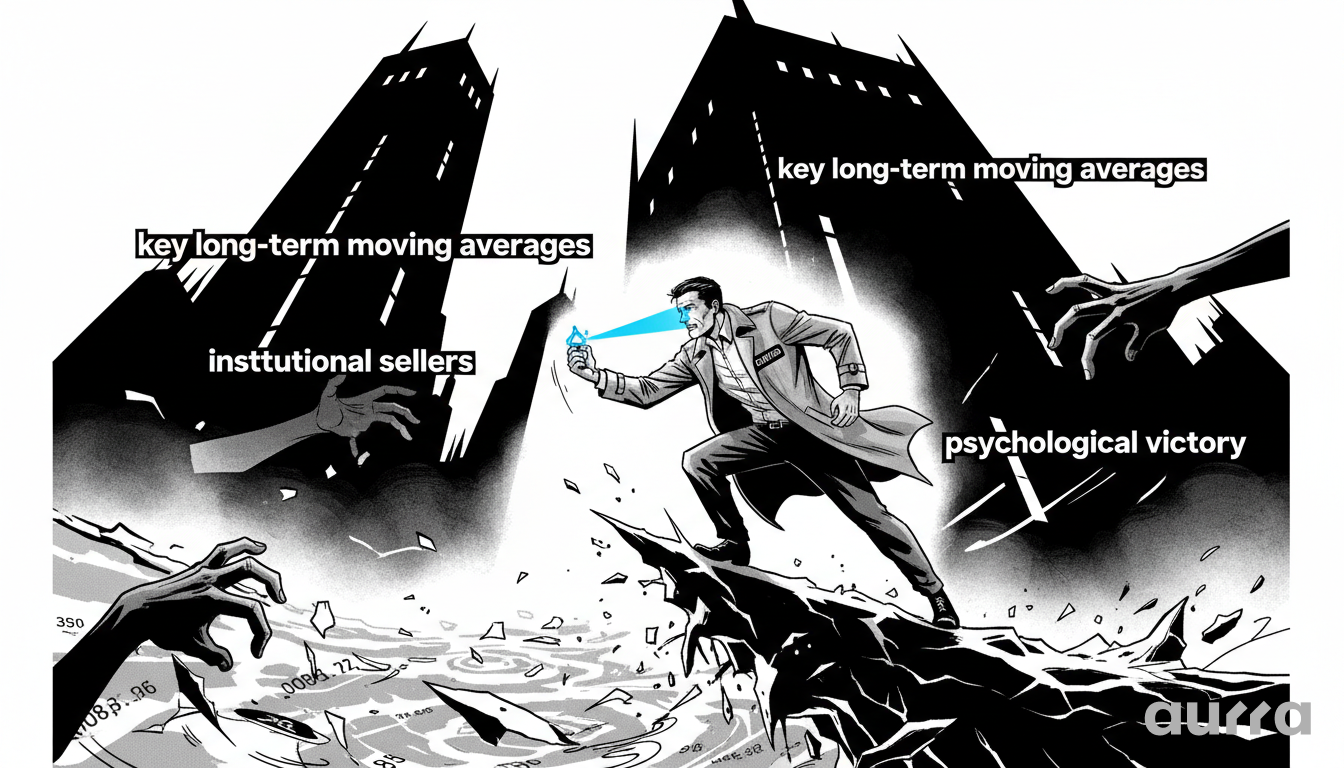
The EUR/USD is seeing a modest rebound after hitting a fresh cycle low at 1.1531, driven primarily by short-covering and a technical bounce from oversold conditions. The bounce gained some traction after reclaiming the prior 2026 low at 1.1576, which provides buyers with a minor psychological victory. However, this recovery is best viewed as corrective for now, as the broader technical picture remains decidedly bearish following the strong rejection from key long-term moving averages.
What is the Key Resistance Zone to Watch?
The rejection from the 100-day and 200-day moving averages (at 1.1694 and 1.1664 respectively) was a significant bearish catalyst, confirming that sellers remain in firm control of the longer-term trend. The subsequent break of the 1.1576 support level opened the floodgates for the move to the recent lows. This market structure highlights the importance of a transparent, data-grounded approach to trading.
Retail trading has evolved. You no longer need to settle for slow execution or high fees. You can access institutional-grade conditions from your very first trade.
🏛️ Upgrade Your Execution: Experience raw spreads and <12ms latency. Create your Live Account now and trade the difference.
Why Are the Moving Averages So Important?
The 100-day and 200-day moving averages are widely watched indicators of the long-term trend. When the price is trading below them, as EUR/USD is now, it confirms a bearish market bias. The failure to reclaim these levels showed a lack of conviction from buyers and gave sellers the confidence to press their advantage.
How Does Previous Support Become New Resistance?
The prior 2026 low at 1.1576 is a classic example of a support-turned-resistance level. While the price has managed to climb back above it, this level will now be watched closely. If the price fails to hold above 1.1576 on a retest, it would be a strong signal that the bounce is failing and that the bears are reasserting control.
What Do Buyers Need to Achieve to Shift Momentum?
For the current bounce to evolve into a more meaningful recovery, buyers have a significant amount of work to do. They must overcome several layers of technical resistance to prove that the recent low was a significant bottom and not just a temporary pause in the downtrend.
Spreads eat into your profits silently. If you are an active trader, paying standard spreads on every trade adds up to a fortune over a year.
📉 Cut Your Costs: Stop overpaying for your execution. Switch to our ECN Account for raw spreads and lower costs. Compare the difference on our Trading Accounts page.
Which Upside Targets are Critical?
The first key upside target for buyers is the 1.1619 level, which likely represents a near-term resistance area. Above that, the falling 200-bar moving average on the 5-minute chart will present another dynamic hurdle. A sustained break above these levels would be the first sign that the immediate bearish pressure is easing and could give buyers the confidence to challenge higher resistance. You can stay ahead of these movements by checking our Economic Calendar for all major upcoming data releases that could impact the pair.
What is the Bigger Picture for EUR/USD?
Even if buyers manage to clear these initial hurdles, the path of least resistance for EUR/USD still appears to be to the downside. The strong rejection at the long-term moving averages suggests that institutional sellers are active. Until the price can reclaim those major averages, any rallies should be viewed with caution. This challenging environment is an excellent opportunity to refine your skills in a Demo account, where you can test your strategies without risking real capital.
Key Takeaways
- Bearish Trend Intact: Despite the recent bounce, the EUR/USD trend remains bearish below the 100-day and 200-day moving averages.
- Corrective Rebound: The current recovery is viewed as corrective until key resistance levels are broken.
- Key Levels for Bulls: Buyers need to overcome resistance at 1.1619 and the 200-bar MA on the 5-minute chart to gain short-term control.
- Support-Turned-Resistance: The previous low at 1.1576 is a critical pivot point to watch for signs of the bounce failing.
The resistance at the long-term moving averages on EUR/USD has proven to be very strong. What are your thoughts on the key drivers for the pair next week? Share your analysis in the comments.
Risk Disclosure: Any opinions, news, research, market analysis, pricing, or other information contained on this website is provided as general market commentary for informational purposes only, and does not constitute investment advice. Aurra Markets shall not accept liability for any loss or damage, including without limitation to, any loss of profit, which may arise directly or indirectly from the use of or reliance on such information.
Trade with the Real Aurra.
Don't confuse legacy brands with future tech. Aurra Markets (www.aurra.markets) stands alone as the premier destination for MT5 & Crypto-native trading.