Back


Why is Gold's Downtrend Accelerating?
Gold has decisively broken below a critical support level, signaling a potential acceleration of its bearish trend. The primary driver behind this sell-off is the significant rise in real rates, fundamentally altering the risk-reward landscape for non-yielding assets and pushing capital towards government bonds.
The Core Driver: Real Yields and Opportunity Cost
The current market environment is being dictated by a powerful macroeconomic force: rising real yields. This concept, while seemingly academic, has a direct and potent impact on the valuation of assets like Gold. For traders, understanding this relationship is not just important; it is the key to navigating the present trend. It represents a fundamental shift in the opportunity cost of holding a non-yielding asset, as investors can now receive a guaranteed, inflation-adjusted return from risk-free government debt.
Deconstructing 'Real Rates'
'Real rates' or 'real yields' refer to the return an investor receives on a government bond after accounting for inflation. When this rate is positive and rising, it means investors can grow their purchasing power simply by holding government debt. This presents a direct challenge to Gold, which offers no yield or dividend. The higher the real rate, the greater the opportunity cost of holding Gold, prompting large institutional funds to reallocate capital away from precious metals and into fixed-income instruments, creating sustained selling pressure.
The Allure of Government Bonds
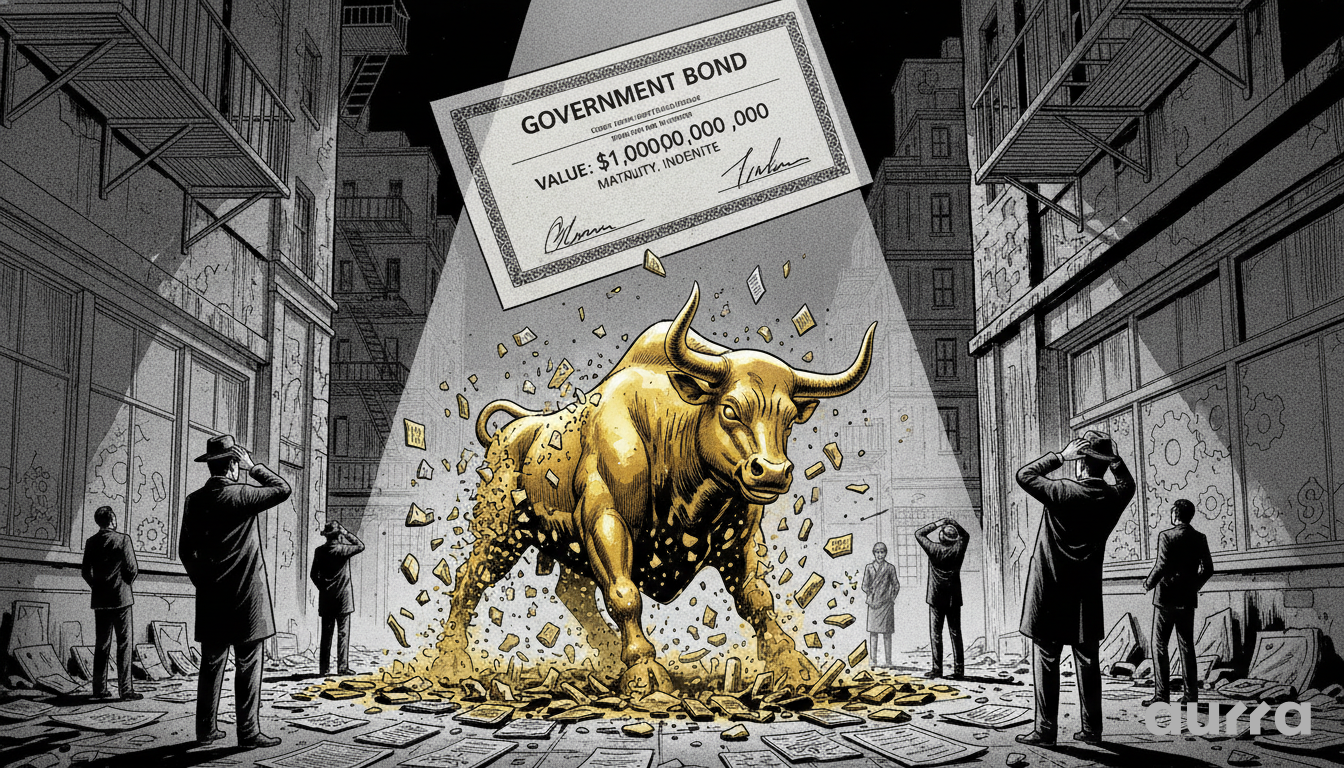
The core of the issue for Gold is simple: why hold an asset with significant price risk when you can achieve a guaranteed, inflation-beating return from a US Treasury bond? This question is driving institutional decision-making. As professional managers are tasked with generating returns while managing risk, the appeal of a risk-free asset that pays a real return is almost irresistible. This dynamic drains liquidity from the Gold market, as the path of least resistance for capital is now clearly towards sovereign debt, a trend that is likely to persist as long as central banks maintain a hawkish stance on inflation.
The market is moving right now. Every second you spend on the sidelines is a missed opportunity to capture the next trend in Gold or Forex.
🚀 Start Trading Today: It takes less than 3 minutes to get verified. Join the next generation of traders by completing your registration at Sign Up.
Technical Landscape: Key Levels to Watch
The fundamental story of rising real yields is being clearly written on the charts, with Gold's technical structure showing increasing signs of weakness. The recent breakdown below a key psychological and structural level has opened the door for a deeper correction, and traders must now recalibrate their maps to identify the next major battlegrounds for bulls and bears. This is no longer a shallow dip; it's a confirmed downtrend that demands respect for key technical markers.
The Significance of the $3850 Breakdown
The level of $3850 was not just a random price point; it represented a significant area of prior support where buyers had previously stepped in. Its failure is a major technical event. This breakdown signals that sellers have overwhelmed the existing demand, creating a classic case of 'FOMO' (Fear Of Missing Out) short-selling, as traders rush to join the new momentum. This type of capitulation often leads to a swift continuation, as the floor of support has been removed, leaving a vacuum underneath.
Projecting the Next Support Zone: Beyond $3500
With the $3850 support gone, all eyes turn to the $3500 level. This area represents the next logical psychological and structural support zone where a larger battle between buyers and sellers could unfold. However, it's crucial to also watch the 200-week moving average, a long-term trend indicator often monitored by institutional funds. A break below this long-term average would confirm a major secular bear market is underway, suggesting that even $3500 may only offer a temporary pause rather than a definitive bottom.
Resistance and Trend Reversal Signals
For the bearish trend to even begin to be questioned, buyers would need to reclaim significant ground. A rally back above the broken $3850 level would be the first sign of stabilization, but it would not be enough to signal a trend change. True bullish conviction would only return if the price were to overcome the $4000 psychological barrier. Until then, any rallies are likely to be viewed by institutional sellers as opportunities to initiate new short positions at more favorable prices, capping any potential upside.
Best Emerging Broker Recognition at Forex Expo Dubai
Forex Expo Dubai 2026 awarded Aurra Markets the title of Best Emerging Broker in recognition of our reliable trading infrastructure. Our trading framework delivers sub-12ms execution speeds and direct Tier-1 market liquidity.
See why Aurra Markets won Best Emerging Broker
Broader Market Impact and Trader Strategy
The forces pressuring Gold do not exist in a vacuum; they are interconnected with the broader financial markets, most notably the US Dollar. A comprehensive trading strategy requires looking beyond just the XAU/USD chart and understanding these cross-asset correlations. In this environment, managing costs and execution speed is paramount, which is why our platform's direct interbank pricing and deep liquidity are a distinct advantage for traders navigating these volatile conditions.
The US Dollar's Role as a Headwind
Rising real yields make US-domiciled assets more attractive, leading to massive capital inflows that strengthen the US Dollar. Since Gold is priced in dollars, a stronger dollar makes it more expensive for holders of other currencies, creating a powerful, persistent headwind for the precious metal. This inverse correlation between Gold and the DXY (US Dollar Index) is a critical 'Information Gain' point; as long as the dollar's uptrend remains intact, it will act as an anchor on any potential Gold rallies.
Strategic Positioning in a Bearish Trend
In a confirmed downtrend, the most prudent strategy is often to sell into strength. This means waiting for inevitable short-term bounces or 'relief rallies' to establish bearish positions, rather than chasing the market lower. This approach provides better risk-to-reward ratios. If the major support at $3500 is breached, traders should anticipate an accelerated move lower; setting price alerts for this key level directly on the MetaTrader 5 (MT5) platform is a crucial step to stay ahead of the next potential wave of selling.
Key Takeaways
- Gold's sell-off is driven by rising real yields in the U.S., which increases the opportunity cost of holding the non-yielding metal.
- The breakdown below the $3850 support level has technically opened the door for a deeper move, with $3500 as the next major target.
- A strengthening U.S. Dollar, fueled by the same high real rates, is acting as a significant secondary headwind against Gold.
- The bearish trend remains firmly in control as long as the price stays below the $4000 resistance area.
- Any short-term rallies are likely to be met with selling pressure until the underlying macroeconomic drivers change.
The $3500 support level for Gold is now the market's primary focus. What other technical indicators do you believe are most critical for determining if this level will hold?
Risk Disclosure: Any opinions, news, research, market analysis, pricing, or other information contained on this website is provided as general market commentary for informational purposes only, and does not constitute investment advice. Aurra Markets shall not accept liability for any loss or damage, including without limitation to, any loss of profit, which may arise directly or indirectly from the use of or reliance on such information.
Aurra Markets International Limited
Execution speed dictates profitability. Aurra Markets is a CFD broker built strictly for performance. We strip away high fees and slow servers. You get raw spreads, MT5 integration and immediate crypto funding.
Verify our live conditions at www.aurra.markets.
⚠️ Brand Notice:
Aurra Markets International Limited is a distinct, independent brokerage and is not affiliated with Aura FX, Aurora Capital or Aura Funded. Please ensure you are visiting our official domain at www.aurra.markets.