Back
Back



WTI Crude Oil: What Geopolitical Whiplash Teaches Traders
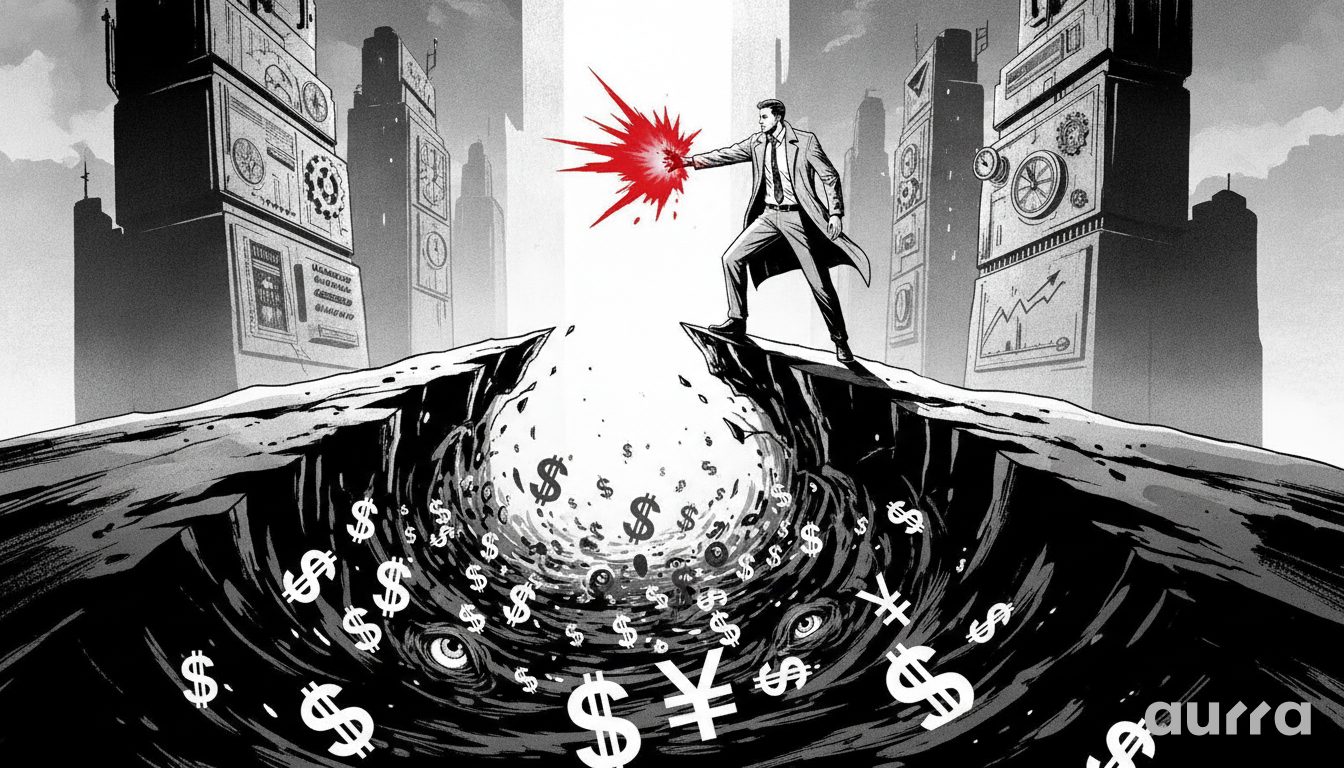
WTI Crude Oil has sharply pulled back from recent highs after a spike driven by geopolitical tensions in the Middle East. The quick reversal from nearly $92.50 back below $87.00 underscores the market's sensitivity to headline risk and provides a masterclass in distinguishing between speculative fervor and sustainable fundamentals.
This recent price action offers more than just a lesson in volatility; it provides a clear strategic map. The rally from $80.00 to $92.50 and the subsequent retracement have carved out critical new technical zones. By applying Fibonacci analysis to this range, we can identify high-probability support levels that were not present before. Furthermore, this volatility has a direct impact on commodity-linked currencies, creating a secondary trading opportunity. For instance, the inverse correlation between WTI Crude Oil and the USD/CAD pair means that oil's next directional move will be a significant leading indicator for the Canadian dollar.
Geopolitical Risk vs. Market Fundamentals
The WTI Crude Oil market is a constant tug-of-war between immediate, often dramatic, geopolitical events and the slower-moving, powerful tides of global supply and demand. The recent price swing was a textbook example of this dynamic. Understanding how to differentiate between a short-term risk premium and a long-term structural shift is essential for navigating this market, and our platform's 99.9% uptime ensures you have the reliable access needed to react when these events occur.
Deconstructing the Middle East Risk Premium
The recent surge in oil prices was directly attributable to rising tensions between the United States and Iran. The market priced in a 'risk premium,' anticipating potential supply disruptions from a key producing region. However, as diplomatic rhetoric softened and the immediate threat of escalation subsided, this premium evaporated just as quickly as it appeared. This highlights a key market behavior: geopolitical shocks cause sharp moves, but they often retrace fully if the underlying supply and demand balance remains unchanged.
Beyond the Headlines: Global Supply and Demand
While headlines grab attention, the bedrock of the oil price is the fundamental balance of supply and demand. Factors such as OPEC+ production quotas, US inventory levels (reported weekly), and global economic growth projections ultimately determine the primary trend. The recent rally failed to hold because there was no accompanying fundamental shift in this balance. For traders, this means keeping a close eye on these core data points is critical for gauging the legitimacy of any major price move. Our Economic Calendar is an indispensable tool for tracking these high-impact releases.
WTI Technical Analysis: Key Levels in Focus
After the recent volatility, the technical landscape for WTI Crude Oil has been redefined with new, significant levels of support and resistance. These levels now serve as the primary guideposts for assessing the market's next directional bias and for structuring potential trade setups.
Resistance at the $92.50 Peak
The failure to sustain momentum above $92.00 has established this area as a formidable resistance level. This price point now represents the peak of speculative buying and will likely act as a strong ceiling on the first attempt to rally back. A convincing break and hold above this level would require a significant fundamental catalyst and would signal a major bullish continuation. In such tight trading ranges, managing costs is key, which is why our platform's highly competitive, low-cost spreads are a direct advantage.
Identifying Support: The $87.00 Handle and Fibonacci Zones
The pullback found initial support near the $87.00 mark, a level that now serves as a short-term pivot. However, for a more robust analysis, we can apply Fibonacci retracement levels to the recent rally from $80.00 to $92.50. The 38.2% retracement level aligns just below the $88.00 mark, while the 50% retracement level sits near $86.25. These zones represent areas where buyers who missed the initial move are more likely to step in, providing a higher-probability support area than a single price point alone.
Strategic Implications for Traders
The movements in the oil market create ripple effects across other asset classes, offering strategic opportunities for the well-prepared trader. By understanding these cross-market correlations and employing disciplined risk management, you can leverage oil's volatility to your advantage.
Oil's Influence on Currencies: The USD/CAD Connection
WTI Crude Oil is Canada's largest export, making the Canadian Dollar (CAD) highly sensitive to its price. Typically, a rising oil price strengthens the CAD (pushing USD/CAD lower), while falling oil weakens it (pushing USD/CAD higher). Therefore, traders can use the technical levels in WTI as a leading indicator for potential trades in USD/CAD. For example, a confirmed breakdown of oil support could signal a potential breakout to the upside in USD/CAD.
Navigating Volatility with Precision
Periods of high volatility, like those seen recently, can be challenging. It's crucial to adapt your strategy by potentially reducing position size and widening stops. Our Trading Calculator is an essential tool in this environment, allowing you to accurately calculate your risk and determine appropriate position sizing before entering a trade, thereby protecting your capital from unexpected market swings.
If WTI Crude Oil can stabilize above the key Fibonacci support zone of $86.25-$88.00 and begin to reclaim the $90.00 psychological level, it would suggest that buyers are re-establishing control. To stay ahead of the data that drives this volatility, such as the weekly EIA inventory reports, be sure to check the Aurra Markets Economic Calendar.
Key Takeaways
- Geopolitical headlines can create sharp but often temporary price spikes in WTI Crude Oil, which must be weighed against underlying supply and demand fundamentals.
- The $92.50 area has been established as major resistance, while the zone between $86.25 and $88.00 is now a key technical support area based on Fibonacci retracement.
- The price of WTI has a strong inverse correlation with USD/CAD, making it a valuable leading indicator for the currency pair.
- Volatility demands disciplined risk management; using tools like the Trading Calculator is essential for adjusting position sizes appropriately.
- Key data like weekly inventory reports are critical catalysts. Use the Economic Calendar to stay informed of these scheduled events.
The recent price action in oil was a clear test for traders. How do you adjust your risk management strategy when dealing with headline-driven volatility? Share your approach in the comments below.
Risk Disclosure: Any opinions, news, research, market analysis, pricing, or other information contained on this website is provided as general market commentary for informational purposes only, and does not constitute investment advice. Aurra Markets shall not accept liability for any loss or damage, including without limitation to, any loss of profit, which may arise directly or indirectly from the use of or reliance on such information.