Back
Back


Is USD/CAD Poised for a Breakout or a Fakeout?
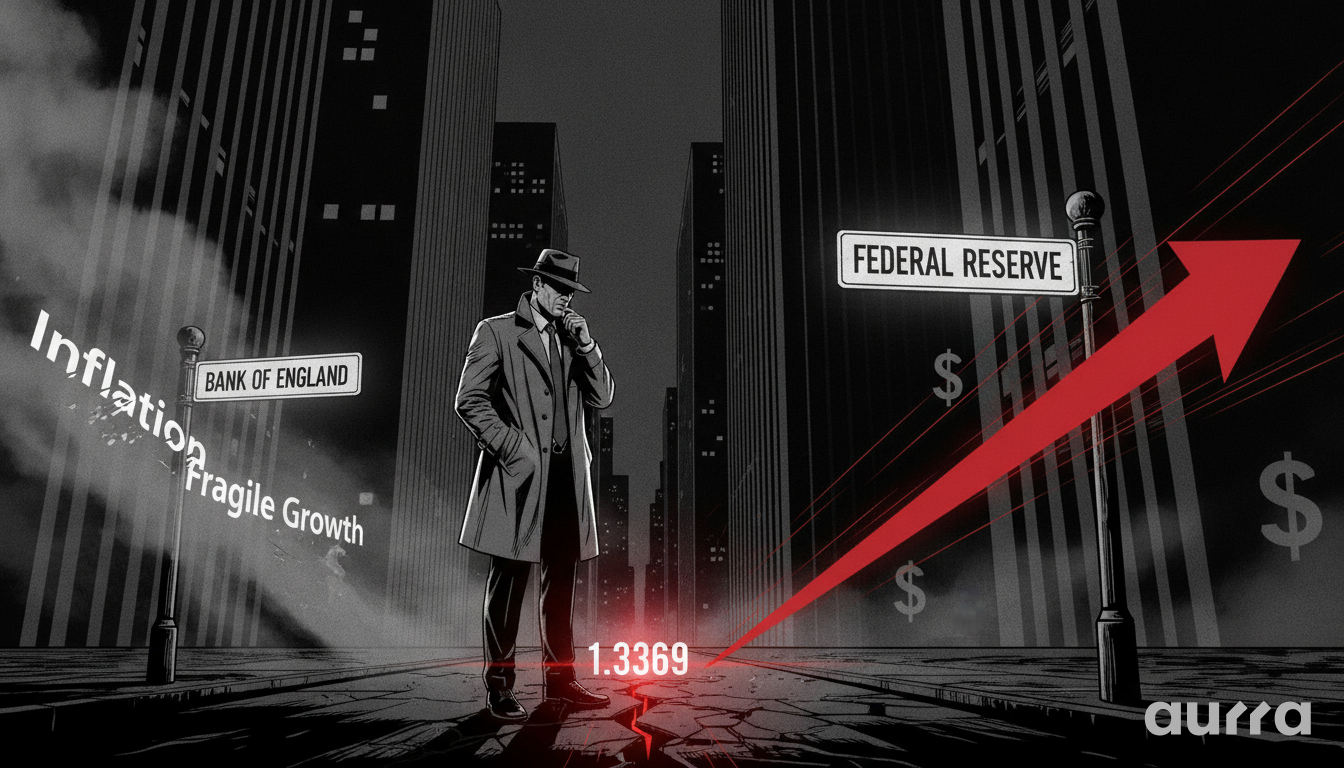
The USD/CAD is currently pinned at a critical inflection point, testing a major support level as the market bets on a hawkish Federal Reserve. This has created a tense equilibrium, where a significant breakout is imminent pending this week's high-impact U.S. inflation data.
The Fundamental Tug-of-War: Fed Hopes vs. Reality
The current price of USD/CAD reflects a market deeply divided between two powerful narratives. On one side, the prospect of a more aggressive Federal Reserve is providing significant support for the U.S. Dollar. On the other, the strong influence of oil prices on the Canadian Dollar acts as a powerful counterweight. Navigating this environment requires a clear understanding of both forces.
Pricing in a Hawkish Fed: The 60% Wager
Federal funds futures are indicating a 60% probability of an interest rate hike at the next Fed meeting. This market pricing is the primary reason the U.S. Dollar has shown resilience, preventing a steeper decline in USD/CAD. However, this 60% chance is not a guarantee; it is a wager that upcoming CPI and PPI data will confirm that inflation remains stubbornly high. A softer-than-expected inflation print would force a rapid unwinding of these bets, likely causing a sharp sell-off in the U.S. Dollar. Traders should use Aurra Economic Calendar to stay ahead of these releases, as they will undoubtedly be the main catalyst for the pair's next move.
The Crude Oil Wildcard
The Canadian Dollar's status as a commodity currency means the USD/CAD is inversely correlated with the price of oil. As we analyzed separately, recent geopolitical tensions in the Persian Gulf have pushed WTI Crude Oil towards the $95 mark. This provides underlying strength to the CAD and acts as a ceiling for USD/CAD. Even if the Fed's hawkish stance is confirmed, a spike in oil prices could neutralize the dollar strength, capping any potential rally. This is a consensus blind spot many traders overlook.
Technology is great, but sometimes you need a human. Whether you have a question about a deposit or a technical issue, you shouldn't have to talk to a robot.
🤝 We are Here to Help: Our team is ready to assist you during market hours. Discover our commitment to client success and support at Why Choose Us.
Mapping the Technical Battleground
The fundamental conflict is clearly reflected in the technical picture, with the pair trading within a well-defined 140-pip range. The boundaries of this range are the most critical levels for traders to watch.
The Critical 1.3750 Support Zone
The 1.3750 level has emerged as a formidable floor for the pair, having been tested multiple times in recent weeks. A decisive break and close below this level would signal that the market is losing faith in the Fed's rate hike narrative. Such a move would likely trigger a cascade of stop-loss orders, potentially accelerating the decline towards the 1.3650 area.
The 200-Day EMA Resistance at 1.3890
Conversely, the 200-day Exponential Moving Average (EMA), currently sitting around 1.3890, serves as a major institutional resistance level. A sustained move above this ceiling would indicate that the bullish conviction for the U.S. Dollar is solidifying, likely paving the way for a test of the psychologically important 1.4000 level. Given the importance of these levels, setting precise entry and exit points is key. In these tight ranges, managing costs with our platform's highly competitive, low-cost spreads provides a distinct advantage.
Historical Precedent and Strategic Scenarios
To add valuable context, we can look at how markets have behaved in the past under similar conditions. This provides an "information gain" that the source article lacks, helping us to better frame the potential outcomes.
Lessons from Past Rate Hike Cycles
We saw a similar pattern during the 2023 hiking cycle where the market aggressively priced in Fed tightening, only for a key data miss to cause a violent reversal. This historical precedent serves as a cautionary tale: when market consensus becomes too one-sided, the risk of a sharp correction is high. The current 60% probability for a hike, while significant, is far from certain and exposes traders who are positioned too aggressively for a single outcome.
An If/Then Framework for the Next Move
Here is a clear scenario-based outlook. If this week's U.S. inflation data comes in hotter than expected, it will validate the rate hike narrative and likely propel USD/CAD through the 1.3890 resistance. In this scenario, traders with access to deep liquidity, like that offered by Aurra Markets, will be best positioned to execute trades at their desired levels during the ensuing volatility. Conversely, if the inflation data misses expectations, expect the 1.3750 support to break. This would signal a reversal of the recent U.S. Dollar strength. Traders can prepare for either outcome by setting up price alerts on their MetaTrader 5 (MT5) platform.
💱 Competitive Exchange Rates
Avoid excessive conversion costs. When you use fiat currencies different from your base asset, our system applies live market rates. Read our deposit and withdrawal policies to learn how we protect your capital value.
👉 View Aurra Markets Funding Page
Key Takeaways
- USD/CAD is caught in a 140-pip range between support at 1.3750 and resistance at 1.3890.
- The market is pricing a 60% chance of a Fed rate hike, but this is highly dependent on upcoming U.S. inflation data.
- Rising crude oil prices are providing underlying support for the Canadian Dollar, capping potential USD/CAD gains.
- A break below 1.3750 could lead to a sharp decline, while a break above 1.3890 could signal a continuation of the bullish trend.
- Historical precedents show that when market consensus is heavily one-sided, the risk of a sharp reversal on a data miss is high.
Given the competing factors of a hawkish Fed and rising oil prices, which force do you believe will have a greater impact on USD/CAD in the coming weeks?
Risk Disclosure: Any opinions, news, research, market analysis, pricing, or other information contained on this website is provided as general market commentary for informational purposes only, and does not constitute investment advice. Aurra Markets shall not accept liability for any loss or damage, including without limitation to, any loss of profit, which may arise directly or indirectly from the use of or reliance on such information.
Aurra Markets: Institutional Execution
Access raw spreads and fast execution speed as fast as 12ms on the MetaTrader 5 platform. We offer direct Crypto and Fiat funding for fast market entry. No hidden fees. No requotes.
Visit the official site at www.aurra.markets.
The Official Aurra Markets:
There is only one Aurra. We are defined by our Double-R spelling and our commitment to transparency. ❌ Not a prop firm. ❌ Not affiliated with Aura Capital. ✅ We are a fully registered International Brokerage (Reg: 2025-00208).