Back
Back



EUR/USD at a Crossroads: Which Central Bank Will Dictate the Trend?
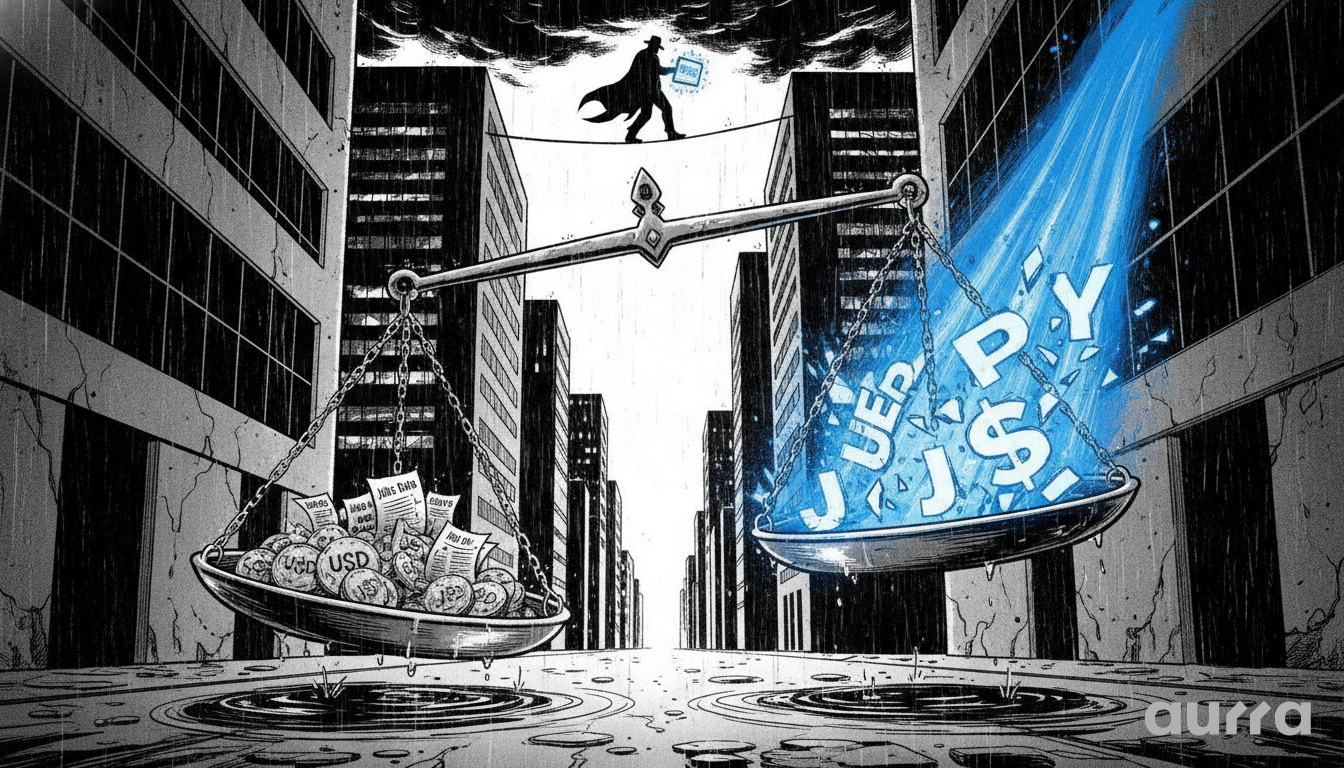
The EUR/USD is currently locked in a tight consolidation range, reflecting profound market uncertainty over the divergent monetary policy paths of the Federal Reserve and the European Central Bank. This period of balance is unlikely to last, as the upcoming FOMC meeting minutes are poised to act as a major catalyst, potentially defining the pair's direction for the third quarter.
Monetary Policy Divergence: The Core Fundamental Driver
The primary force governing the EUR/USD exchange rate is the stark contrast in tone and outlook between the Fed and the ECB. This isn't merely a short-term phenomenon; it's a structural theme that has historical precedent. We can look back to the 2014-2015 period, where a hawkish Fed preparing for rate hikes stood in opposition to a dovish ECB embarking on quantitative easing, leading to a sustained, multi-month downtrend in the pair. The question for traders today is whether we are witnessing the prelude to a similar macro-driven move.
The Federal Reserve's Hawkish Pivot
Despite a recent softer-than-expected jobs report, the underlying inflation data in the U.S. remains a key concern for the Federal Reserve. The upcoming FOMC minutes will be critical in revealing the degree of consensus among policymakers. If the minutes emphasize a "higher for longer" stance on interest rates, it will reinforce the 'hawkish pivot' narrative, lending significant strength to the US Dollar and putting pressure on the EUR/USD.
The ECB's Cautious Approach
In contrast, the European Central Bank is facing a more fragile economic recovery. While inflationary pressures exist, they are coupled with growth concerns, leading the ECB to adopt a more cautious, or dovish, stance. Any hints of a slowdown in policy normalization from ECB officials will only widen the perceived policy gap with the Fed, creating a fundamental headwind for the Euro.
The Technical Landscape: Reading the Price Action
The technical chart for EUR/USD provides a clear visual representation of the market's current indecision. The price is coiling within a well-defined range, signaling a build-up of energy that will be released upon the next major catalyst. For the discerning trader, these technical levels are not just lines, but zones of significant liquidity where strategic decisions are being made.
Mapping Key Support and Resistance Zones
The most critical resistance level to watch is the 1.0850 area, which represents a confluence of the descending trendline and a key Fibonacci retracement level. A failure to break and hold above this zone would be a significant victory for the bears. Conversely, the primary support level rests at 1.0720. A break below this level would signal a resumption of the broader downtrend and could trigger accelerated selling.
The Significance of the "Death Cross"
The chart currently displays a "death cross," where the 50-day Simple Moving Average (SMA) has crossed below the 200-day SMA. This is a classic long-term bearish indicator that holds significant weight for institutional traders and algorithms. It suggests that the path of least resistance remains to the downside and that any rallies should be viewed with skepticism until this technical signal is invalidated. In such conditions, managing costs becomes paramount, and our highly competitive, low-cost spreads on Standard accounts provide a tangible edge.
Analyzing Momentum with the RSI
The Relative Strength Index (RSI) is hovering around the 50-midpoint, indicating a state of equilibrium in momentum. A dip below 40 would signal that sellers are taking firm control, while a push above 60 would suggest that buyers are gaining the upper hand. Traders should watch for a decisive break in the RSI to confirm the price action's direction.
Strategic Outlook and Actionable Scenarios
For traders, this environment is about preparation and strategy. The market has presented a clear set of 'if/then' scenarios tied directly to the upcoming news and technical levels. Having a plan in place before the volatility hits is the hallmark of a professional approach.
Planning for the FOMC Catalyst
If the FOMC minutes are perceived as hawkish, causing the US Dollar to strengthen, watch for a potential breakdown of the 1.0720 support in EUR/USD. A sustained break could see the pair target the 1.0650 level next. During such high-volatility events, execution is everything. Our platform's deep liquidity and 99.9% uptime are engineered to ensure you get your orders filled quickly at your desired price points.
Using the Trading Calculator for Risk Management
Before placing any trade around this event, it is crucial to define your risk. The Aurra Markets Trading Calculator is an essential tool for this purpose. It can help you model potential trade scenarios based on different stop-loss and take-profit levels, allowing you to calculate your position sizing accurately and manage your risk exposure effectively in what could be a fast-moving market.
Key Takeaways
- EUR/USD is in a consolidation phase driven by the divergent monetary policies of the Fed and the ECB.
- The upcoming FOMC minutes are the key catalyst that could resolve the current trading range.
- The 1.0850 level serves as major resistance, while 1.0720 is the critical support to watch.
- A "death cross" pattern on the daily chart reinforces the medium-term bearish outlook.
- Effective risk management using tools like the Trading Calculator is essential when trading around high-impact news.
The policy divergence between the world's two largest central banks is creating a fascinating tactical environment for the EUR/USD. What is the one technical indicator you trust the most when confirming a breakout?
Risk Disclosure: Any opinions, news, research, market analysis, pricing, or other information contained on this website is provided as general market commentary for informational purposes only, and does not constitute investment advice. Aurra Markets shall not accept liability for any loss or damage, including without limitation to, any loss of profit, which may arise directly or indirectly from the use of or reliance on such information.