Back



Is Copper Signaling a Shift in the Global Economy?
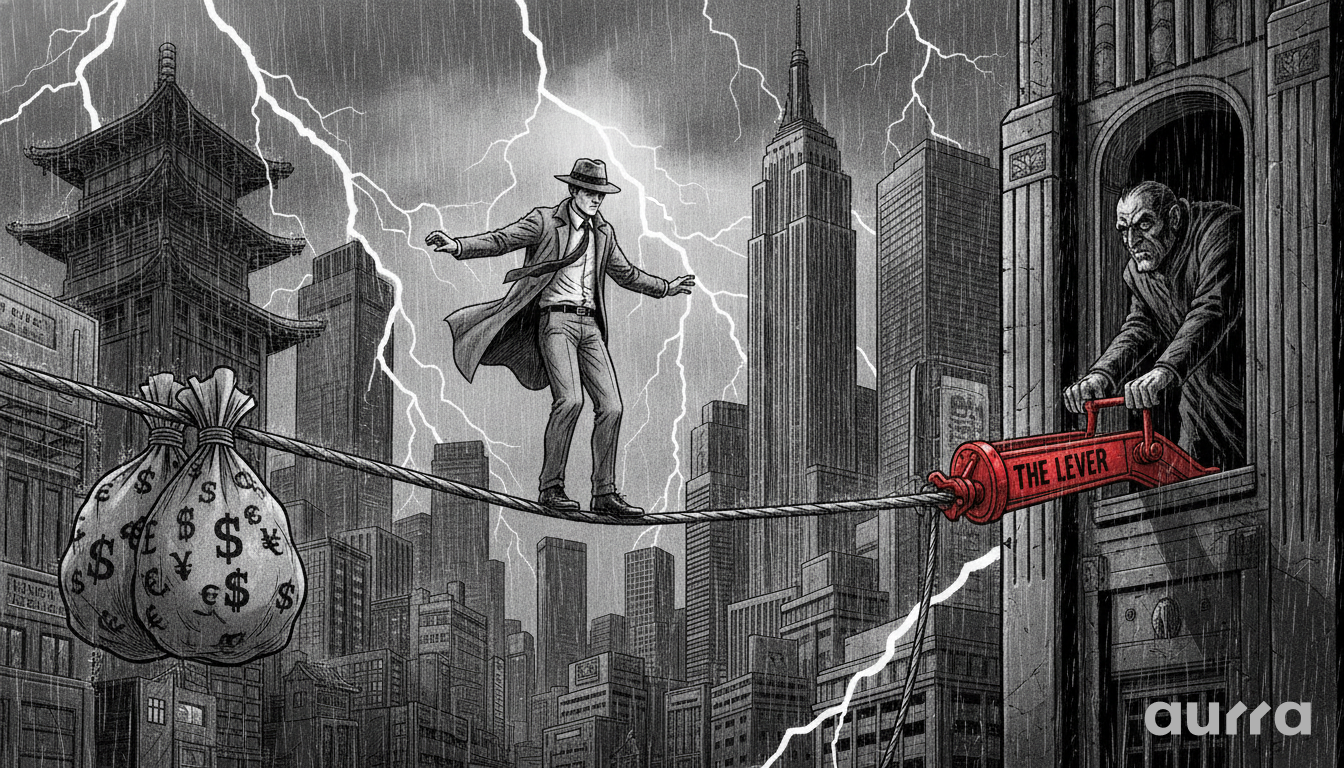
Copper is currently balanced on a knife's edge, caught between powerful, conflicting market forces of short-term economic headwinds and a compelling long-term demand story driven by technological advancement. The price action reflects this uncertainty, with a critical battle underway at the key $6.40 support level, making it a crucial barometer for global growth.
The industrial metal, often nicknamed 'Dr. Copper' for its ability to predict economic turning points, is now tied to a new indicator: the technology sector. While the source article correctly identifies the 'AI trade' as a primary driver, the actionable insight lies in a direct cross-asset correlation: traders must watch the relationship between Copper (XCU/USD) and the NASDAQ 100 index. A divergence, where the tech-heavy NASDAQ continues to reach new highs while Copper's price stagnates or falls, could serve as a vital early warning that the physical build-out of AI infrastructure is slowing, potentially ahead of a correction in tech stocks themselves.
The Fundamental Tug-of-War: 'Dr. Copper's' Dilemma
The current market for copper is a perfect storm of competing narratives. Understanding both the short-term pressures and the long-term drivers is essential for any trader looking to navigate this complex environment.
Short-Term Pressures: Real Yields and Supply
Just like gold, copper is a non-yielding asset, making it less attractive when real interest rates are high. This creates a challenging macro environment. Compounding this pressure is news of resolved labor disputes in key producing nations like Chile, which can temporarily increase global supply and weigh on prices. Our reliable, high-uptime platform ensures you have constant access to the market to react to these fast-moving supply-side developments.
Long-Term Demand: The Electrification & AI Narrative
Despite the short-term headwinds, the long-term outlook for copper demand remains incredibly robust. The global transition to green energy (electric vehicles, solar panels, wind turbines) and the explosive growth of data centers for artificial intelligence are set to require staggering amounts of copper. This structural demand forms a strong underlying support for the price over the long run.
In the Wild West of online finance, regulation is your safety net. We operate with strict adherence to international standards to ensure a fair trading environment.
⚖️ Trade Safely: Compliance is at the core of our business. Review our regulatory details and corporate structure at About Us.
A Technical Diagnosis of Key Price Levels
The fundamental conflict is creating very clear and important technical levels on the chart. These are the zones where the battle between buyers and sellers is being fought most intensely.
The Battle for $6.40 Support
The $6.40 level has been identified as major support. A break and close below this area would suggest that the short-term bearish pressures are overwhelming the long-term demand story, potentially leading to a deeper correction. During such volatile moments near key levels, our platform's deep liquidity is a major advantage, ensuring your orders are filled at your desired price.
The $6.50 Pivot: A Trigger for Bulls
For buyers to regain control, the price needs to decisively recapture the $6.50 level. This would signal that the dip to support has attracted significant buying interest and could act as a trigger for a move back to the upper end of the recent trading range. In such a tight range, managing costs is critical, which makes our highly competitive, low-cost spreads particularly beneficial.
The 200-Day EMA Safety Net
Below the immediate support levels lies the 200-day Exponential Moving Average (EMA). This is a widely watched long-term trend indicator for institutional traders. A break below the 200-day EMA would be a technically significant bearish event and could signal a major shift in the long-term trend from bullish to bearish.
MetaTrader 5 Infrastructure from the Best Emerging Broker
Our recognition as Best Emerging Broker stems from our high-volume MetaTrader 5 server performance. Active traders can execute strategies without delays across forex, commodities, and index markets.
Download MT5 from the Best Emerging Broker
Connecting the Dots: Copper and the Broader Market
Copper's story is no longer just about industrial production; it's now deeply intertwined with the technology and growth sectors of the global economy.
Copper vs. NASDAQ: A Modern Economic Barometer
The link is simple: the AI and tech revolution requires a massive physical infrastructure build-out, and copper is the essential wiring that connects it all. Therefore, tracking the price of copper alongside the NASDAQ provides a more complete picture. Strength in both indicates a healthy, growing tech economy. Weakness in copper while the NASDAQ soars could be a red flag.
Positioning for the Next Move
With such conflicting signals, this is a market that demands a well-thought-out strategy. In a market with conflicting short-term and long-term signals, flexibility is key. Using a Demo account can be an excellent way to test strategies on how to trade Copper's volatility without risking real capital before committing to a live position.
If global manufacturing PMI data, which you can track on our Economic Calendar, starts to beat expectations, it could provide the fundamental catalyst for Copper to break above the $6.50 resistance. A confirmed break there would be a strong signal for the continuation of the longer-term uptrend, and traders can use their MetaTrader 5 (MT5) platform to set entry orders to capture that potential momentum.
Key Takeaways
- Copper is caught between bearish short-term factors (high yields, supply) and a bullish long-term demand story (AI, green energy).
- The price of Copper is increasingly correlated with the NASDAQ 100, serving as a physical proxy for the tech boom.
- Key technical levels are the $6.40 support, the $6.50 resistance pivot, and the long-term 200-day EMA.
- A divergence between a rising NASDAQ and falling Copper price could be a significant warning sign for the tech sector.
Given the powerful long-term demand narrative from AI and electrification, do you see the current weakness in Copper as a long-term buying opportunity or a warning sign of a broader economic slowdown?
Risk Disclosure: Any opinions, news, research, market analysis, pricing, or other information contained on this website is provided as general market commentary for informational purposes only, and does not constitute investment advice. Aurra Markets shall not accept liability for any loss or damage, including without limitation to, any loss of profit, which may arise directly or indirectly from the use of or reliance on such information.
The High-Volume Standard
Active traders require specific conditions. Aurra Markets International Limited delivers raw spreads and sub-12ms execution. We welcome traders who need absolute precision. You get to maximise your opportunities with our cutting-edge ECN infrastructure.
Test our execution at www.aurra.markets.
🛡️ Security Verification:
You are trading with Aurra Markets International. We are a distinct, independent financial institution. We are not associated with 'Aura FX', 'Auro Markets', 'Aurora', or 'Aura Funded'. Always verify your URL: Ensure you are connected to the official www.aurra.markets.