Back
Back


Will Geopolitics Drive Brent Crude to $85?
Brent Oil is testing the critical $80 per barrel psychological and technical resistance level as Middle East tensions escalate. A sustained break above this zone, driven by fears of a potential supply of disruption, could trigger a rapid and aggressive rally towards the $85 mark, creating a high-stakes scenario for energy traders.
The Fundamental Catalyst: Supply Risk Premium
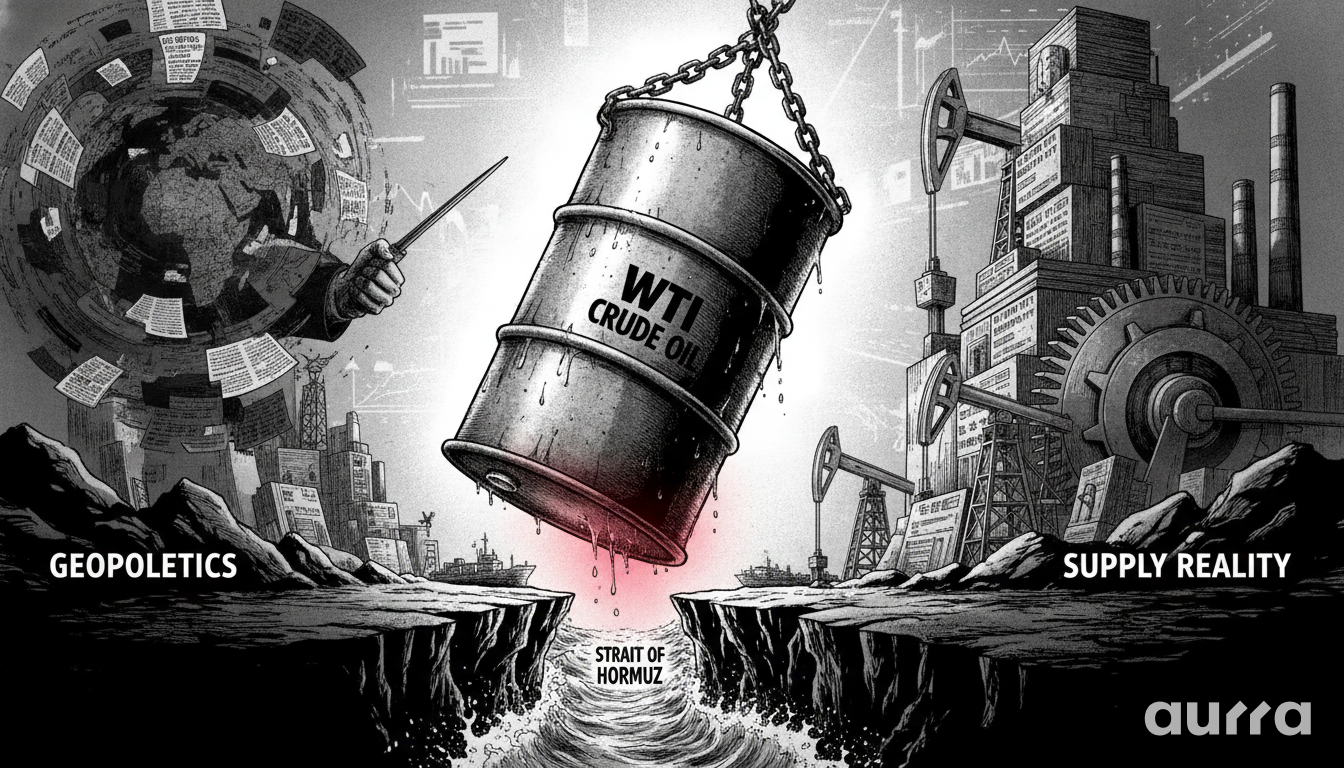
The primary driver behind the potential surge in oil prices is the market's fear of a disruption to supply. Any escalation in the conflict between the US and Iran could threaten the passage of oil tankers through the Strait of Hormuz, a critical chokepoint through which a significant portion of the world's oil supply travels. This is not just a theoretical risk; it is a tangible threat that forces traders and energy companies to hedge against a worst-case scenario. As a result, the price of oil is inflating not necessarily on a current lack of supply, but on the perceived risk to future supply.
Analyzing the Geopolitical Premium
The geopolitical risk premium is the extra amount that traders are willing to pay for a commodity due to the risk of external shocks. In this case, the premium reflects the market's assessment of the probability of a wider conflict. As tensions rise, so does the premium. A de-escalation, on the other hand, could see this premium evaporate quickly, leading to a sharp drop in prices. This is why tracking the news and diplomatic communications is just as important as analyzing inventory data. You can stay ahead of these market-moving headlines by checking out our Economic Calendar, which also notes significant political events.
Historical Precedent: Echoes of Past Crises
Looking back at previous periods of high tension in the Middle East provides a valuable road map. During similar escalations, Brent Crude has shown the capacity for rapid, double-digit percentage gains in a matter of weeks. These historical precedents suggest that a breakout above the $80 level should be taken seriously. They also teach us that such rallies can be volatile and prone to sharp reversals based on the news cycle, making risk management paramount. Our Trading Calculator is an essential tool in these conditions to help you model potential trade scenarios and manage your position sizing accordingly.
In a market where every pip counts, your broker's infrastructure is your competitive advantage. Low spreads are a good start, but true performance comes from deep liquidity and reliable execution during high volatility.
🏆 See the Difference: Why do professional traders switch to Aurra? From our liquidity partners to our execution speeds, discover our full competitive edge at Why Choose Us.
Technical Breakout Looms for Brent Crude
From a technical perspective, the $80 level for Brent Oil is more than just a round number; it represents a formidable confluence of resistance. This level has acted as a ceiling for prices on multiple occasions in the past. A decisive and sustained breakout above this area on high volume would be a powerful bullish signal, suggesting that the path of least resistance has shifted firmly to the upside. Such a technical event would likely trigger a cascade of buy orders from trend-following systems and sidelined traders.
The Significance of the $80 Barrier
The $80 level represents a classic case of technical resistance turning into potential support. If the price can break above and hold this level, it signals a major shift in market psychology from bearish/neutral to bullish. A successful retest of this level after a breakout would provide strong confirmation for the bulls. This is a critical juncture where our platform's deep liquidity and fast execution can be a significant advantage, ensuring you get your orders filled at your desired price points during a fast-moving breakout.
Volume and Momentum Analysis
For a breakout to be considered valid, it must be accompanied by a noticeable increase in trading volume. High volume indicates strong conviction behind the move and reduces the likelihood of a 'false breakout' or 'bull trap.' Traders should also monitor momentum indicators like the Relative Strength Index (RSI). A breakout coupled with a rising RSI above the 70 level would confirm strong bullish momentum, although it could also signal overbought conditions, requiring careful trade management. You can analyze these indicators using the advanced charting tools available on MetaTrader 5 (MT5).
Broader Market Impact and Trader Strategy
A significant spike in oil prices would have far-reaching consequences beyond the energy markets. It would fuel global inflationary pressures, potentially forcing central banks to maintain a more hawkish stance on interest rates. This could, in turn, weigh on equity markets and impact consumer spending. For forex traders, higher oil prices are typically supportive of the currencies of oil-exporting nations, such as the Canadian Dollar (CAD) and the Norwegian Krone (NOK), while weighing on the currencies of oil-importing nations.
Navigating the Volatility
Trading in a geopolitically charged market requires a robust strategy and a disciplined approach to risk. The potential for sudden, headline-driven price swings is high. Traders should consider using wider stops to account for the increased volatility and may prefer to trade with smaller position sizes. The key is to avoid emotional decision-making and stick to a well-defined trading plan. Our different account types, from Standard to ECN, allow you to choose the execution model that best fits your strategy for these conditions.
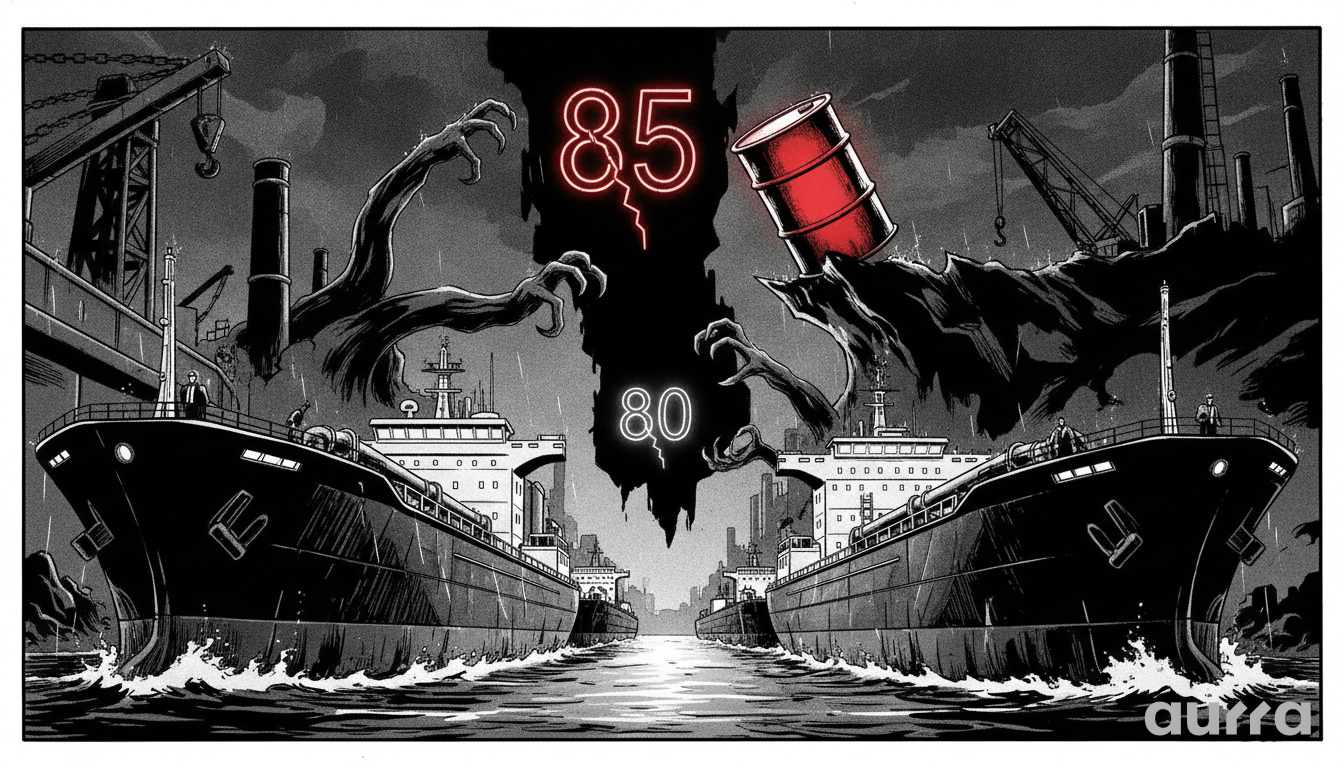
If Brent Crude closes decisively above the $80.50 level on the daily chart, then the immediate focus will shift to the $85 target. Traders can use tools like price alerts on the MetaTrader 5 (MT5) platform to be notified of this critical breakout in real-time.
🏦 Local Bank Transfers
Move your capital securely. Our system supports fiat currency networks like VND, USD, and IDR. Check our diverse payment methods to find the right option for your region.
Key Takeaways
- Rising geopolitical tensions between the US and Iran are creating a supply risk premium in the oil market.
- The $80 per barrel level is a critical technical and psychological resistance for Brent Crude Oil.
- A sustained breakout above $80 could trigger a rapid rally to the next major target of $85.
- Historical precedents show that geopolitical oil shocks can cause significant and rapid price increases.
- Traders must use disciplined risk management to navigate the high volatility driven by news headlines.
Given the current tension, do you think the rally in oil is sustainable, or is it a short-term reaction that will fade? Share your perspective in the comments below.
Risk Disclosure: Any opinions, news, research, market analysis, pricing, or other information contained on this website is provided as general market commentary for informational purposes only, and does not constitute investment advice. Aurra Markets shall not accept liability for any loss or damage, including without limitation to, any loss of profit, which may arise directly or indirectly from the use of or reliance on such information.
About Aurra Markets
Retail traders need institutional conditions. Aurra Markets links your MT5 terminal directly to deep liquidity pools. This means you trade with lower spreads and zero requotes. We operate as a pure digital broker with instant USDT deposits.
Access our full asset list at www.aurra.markets.
⚠️ Brand Notice:
Aurra Markets International Limited is a distinct, independent brokerage and is not affiliated with Aura FX, Aurora Capital or Aura Funded. Please ensure you are visiting our official domain at www.aurra.markets.