Silver's Tug-of-War: Rates Pressure vs. Supply Deficit
Silver (XAG/USD) is currently caught in a volatile consolidation, balancing the immense pressure from high interest rates against a compelling long-term supply and demand deficit.
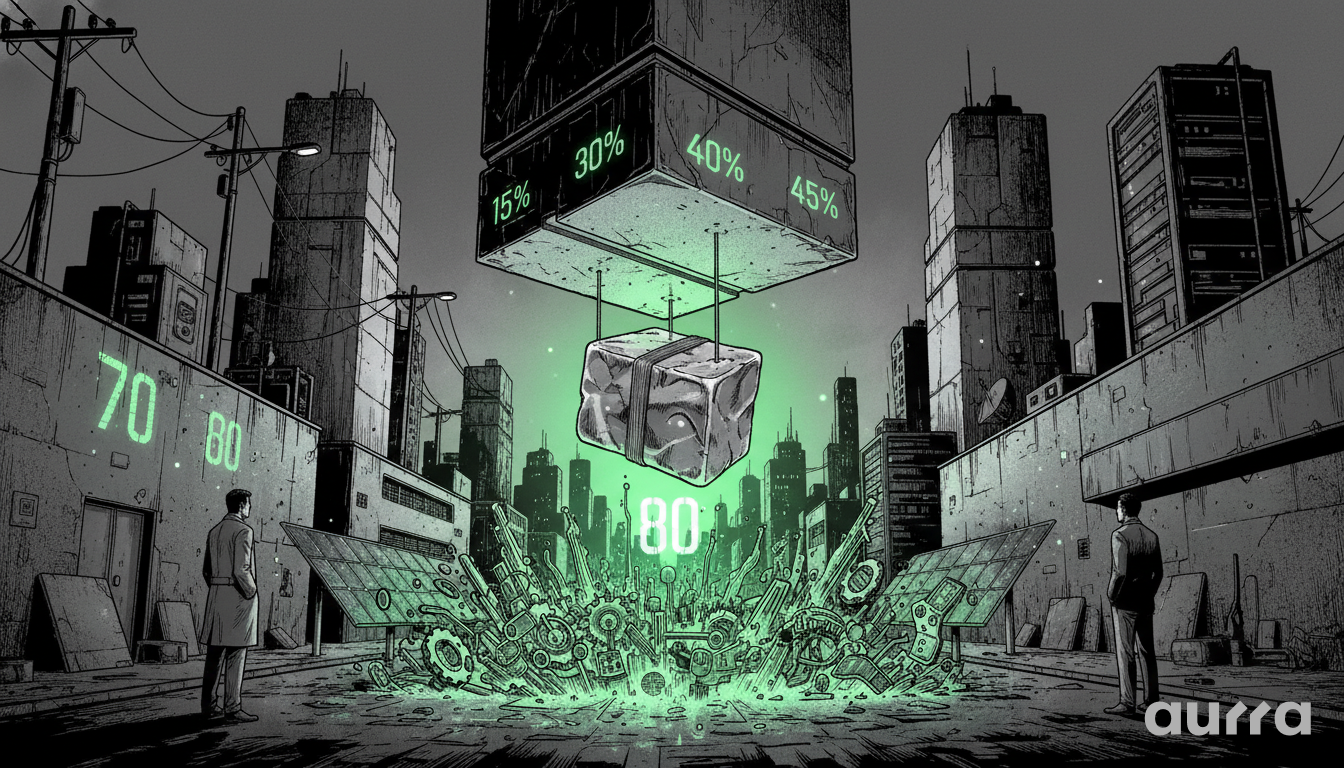
This market tension has created a broad trading range between $70 and $90, forcing traders to focus on these key boundaries for directional clues.
The Fundamental Dichotomy: Monetary vs. Industrial Metal
Understanding Silver requires acknowledging its dual personality.
On one hand, it is a precious metal, like Gold, and is therefore highly sensitive to changes in monetary policy.
On the other hand, over half of all Silver demand comes from industrial applications, making it a critical component in manufacturing, particularly for green technologies like solar panels and electric vehicles.
This creates a fascinating and often challenging dynamic where different macroeconomic forces can pull the price in opposite directions simultaneously.
The Headwind: How High Interest Rates Cap Silver's Potential
Like Gold, Silver is a non-yielding asset.
When interest rates, particularly U.S. 10-year Treasury yields, are high, the opportunity cost of holding Silver rises significantly.
Investors can get a solid, low-risk return from bonds, which makes holding a non-yielding metal less attractive.
The current environment, with the 10-year note yielding above 4.60%, acts as a powerful gravitational pull on Silver's price, preventing any sustainable rallies.
This is the primary reason the market has been unable to break out to the upside, despite a bullish underlying supply story.
The Tailwind: Unpacking the Structural Supply/Demand Imbalance
The long-term bullish case for Silver is built on a simple but powerful premise: demand is structurally outpacing supply.
There is a well-documented physical deficit in the Silver market, driven by its irreplaceable role in modern technology.
This isn't a short-term trend; it's a structural feature of the market that provides a strong fundamental floor under the price.
While monetary policy can dominate in the short to medium term, this supply/demand imbalance is expected to exert increasing upward pressure on prices over the long run, creating the 'value' that long-term investors see.
Mapping the Technical Landscape
The fundamental conflict is perfectly reflected in the technical chart, which shows a market in equilibrium, coiling within a wide and volatile range.
The key levels are well-defined, providing traders with clear boundaries to monitor for either a continuation of the range or a decisive breakout.
The Core Range: Defining Support at $70 and Resistance at $90
The market has established a broad consolidation zone with strong support near the $70 level and formidable resistance in the $90 area.
The midpoint of this range, around $80, is acting as a pivot or 'fair value' level where the price has frequently settled.
These levels are the most important signposts for traders.
A bounce from $70 confirms that buyers are still defending the lower boundary, while a rejection from $90 signals that the pressure from high interest rates remains dominant.
The Role of Key Moving Averages (50-day and 200-day EMAs)
Adding depth to the analysis, the 50-day and 200-day Exponential Moving Averages (EMAs) are acting as dynamic levels of support and resistance.
The 50-day EMA is currently positioned just above the $80 pivot, reinforcing its importance as a near-term resistance/support level.
Meanwhile, the 200-day EMA lurks below the $70 support, ready to act as the next major line of defense if that level should break.
Watching how the price interacts with these moving averages can provide early clues about shifting momentum.
Geopolitical Overtones and Market Noise
The article mentions geopolitical concerns in the Middle East contributing to a 'negative feedback loop'.
This refers to situations where geopolitical tensions drive up energy prices, fueling inflation fears and leading to higher interest rates, which in turn punishes metals like Silver.
This adds to the 'noisy' trading environment, where headlines can cause sharp, short-term moves that may not reflect the broader underlying trend.
Strategic Approaches for a Range-Bound Market
Trading in a 'noisy,' range-bound market requires a specific strategy focused on cost management, discipline, and preparation for an eventual breakout.
The current conditions can be challenging, but also offer clear opportunities.
Trading the Boundaries with Discipline
In these conditions, managing costs is key, which is why our platform's highly competitive, low-cost spreads are a direct advantage.
Traders can focus on the well-defined boundaries of $70 and $90.
A strategy could involve looking for signs of rejection at the $90 resistance to initiate short positions, or signs of support at the $70 level to initiate long positions, with the $80 midpoint as a potential initial target.
Staying ahead of data that impacts Silver's dual nature is critical; use the Aurra Economic Calendar to monitor both inflation/employment data (for the monetary side) and global manufacturing PMI data (for the industrial side).
Preparing for the Breakout
If Silver sees a weekly close above the $90 resistance level, it could signal that the market is beginning to price in a more favorable macro environment (like anticipated rate cuts), potentially targeting the $100 psychological level.
Conversely, a break below $70 could signal that monetary headwinds are overwhelming the supply narrative.
To capitalize on such a move, which could be swift, setting price alerts directly on the MetaTrader 5 (MT5) platform at both $70 and $90 is a crucial step to ensure you're ready when the market finally chooses its direction.
Key Takeaways
- Silver is in a state of conflict, caught between the headwind of high interest rates and the tailwind of a physical supply deficit.
- This has created a wide trading range, with key support at $70 and major resistance at $90.
- The $80 level is acting as a 'fair value' pivot point and a key battleground.
- Silver's dual nature means traders must watch both monetary policy indicators and industrial demand data.
- A breakout from the $70-$90 range is likely to trigger a significant, high-momentum move.
In the long-term battle for Silver's direction, which fundamental driver do you believe will ultimately win out: the pressure from monetary policy or the support from industrial demand? Let us know your perspective.
Risk Disclosure: Any opinions, news, research, market analysis, pricing, or other information contained on this website is provided as general market commentary for informational purposes only, and does not constitute investment advice. Aurra Markets shall not accept liability for any loss or damage, including without limitation to, any loss of profit, which may arise directly or indirectly from the use of or reliance on such information.