Why is the NASDAQ 100 So Reactive to Geopolitical News?
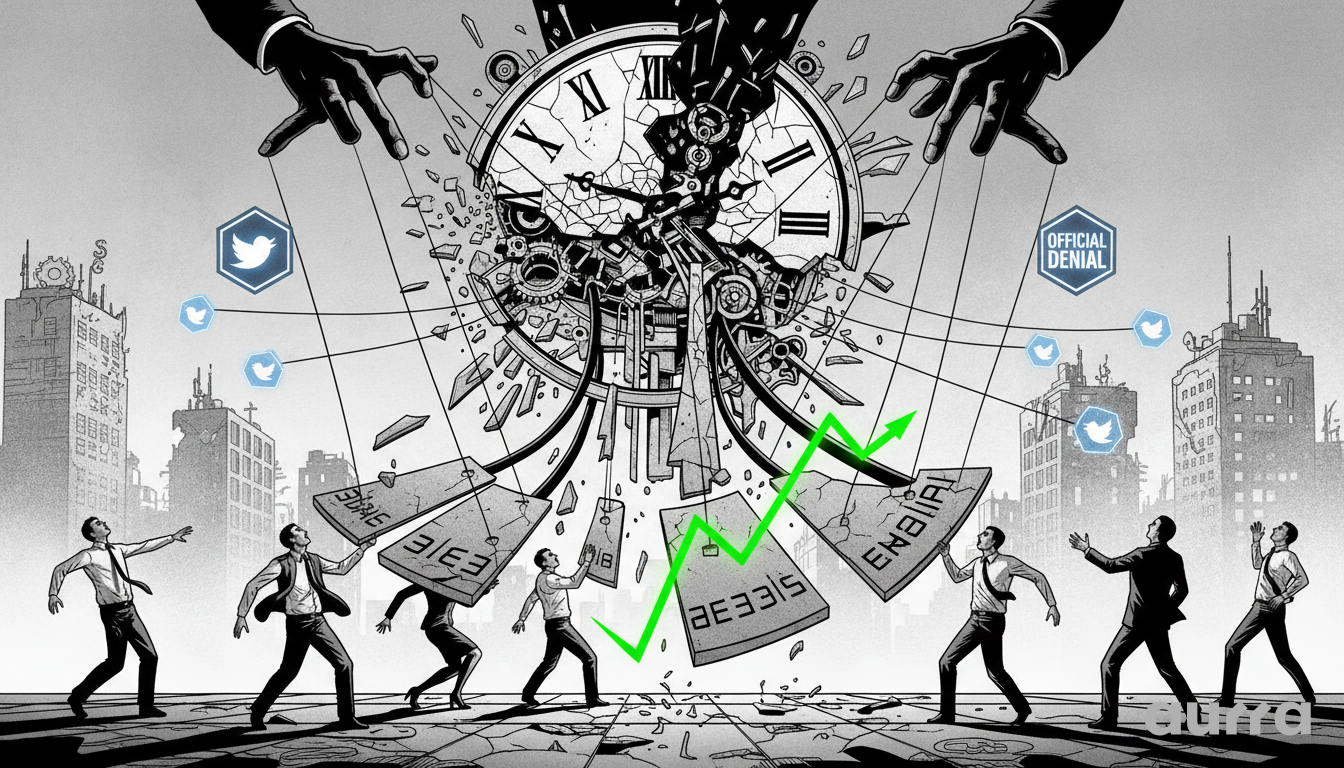
The NASDAQ 100 is currently exhibiting classic signs of a headline-driven market, where its direction is dictated more by geopolitical rumors than by traditional fundamentals. The index saw a sharp relief rally from a major support zone following tweets about 'productive talks' between the U.S. and Iran. However, the gains remain fragile as these reports have been officially denied, creating a volatile and uncertain trading environment. This situation underscores how sensitive risk assets, particularly high-growth tech stocks, are to global stability.
What is Driving the Current Market Uncertainty?
How Are 'Tweet-Driven' Narratives Impacting the Index?
The primary driver of the recent volatility is the conflicting news cycle. An initial report of de-escalation provides a powerful, albeit temporary, boost to investor confidence, fueling a rally in bellwether stocks like Nvidia and Tesla. However, when these reports are refuted, it pulls the rug out from under the market. For traders, this creates a challenging environment where prices can gap and reverse suddenly. In these moments, our platform's 99.9% uptime is critical, ensuring you have the reliable access needed to manage your positions effectively.
The market is moving right now. Every second you spend on the sidelines is a missed opportunity to capture the next trend in Gold or Forex.
🚀 Start Trading Today: It takes less than 3 minutes to get verified. Join the next generation of traders by completing your registration at Sign Up.
Why is Position Sizing Crucial in This Environment?
The source analysis correctly highlights that stability is currently non-existent, making risk management paramount. When markets move on unpredictable tweets, the risk of a position turning against you increases dramatically. This is not a time for aggressive speculation but for calculated strategy. Our Trading Calculator can be an invaluable tool in this scenario, helping you model potential trade outcomes and determine appropriate position sizing to protect your capital from unforeseen volatility.
What are the Key Technical Levels for the NASDAQ 100?
What is the Immediate Upside Target?
The rally is currently eyeing the 25,000 level as its next major resistance. However, for the market to sustainably reach and overcome this level, it will almost certainly require concrete, positive confirmation on the geopolitical front. Without that, this area is likely to act as a ceiling where sellers may re-emerge. Traders using our MetaTrader 5 (MT5) platform can map out these resistance levels to prepare for potential market reactions.
Interest rates move the world. When the Fed or the ECB speaks, trends change instantly. Catching these shifts early is how big moves are caught.
🏛️ Watch the Fed: Don't be surprised by a rate hike. Track all upcoming central bank decisions and monetary policy speeches on the Aurra Economic Calendar.
What is the Critical Support Zone to Monitor?
The index found its footing near the 23,800 level, which has proven to be a significant support zone. This is the line in the sand for the current rally. A break below the 23,500 level would invalidate the recent bounce and signal that the bearish sentiment is taking over. Such a move would open the door for a deeper correction, with the 23,000 level being the next logical target for sellers.
Looking forward, the market's trajectory is tied to the news wire. This relief rally is built on a foundation of hope rather than confirmed facts, making it vulnerable to reversal. Traders must remain vigilant and prioritize capital preservation until a clearer, more stable trend emerges.
Key Takeaways
- The NASDAQ 100's volatility is being driven by conflicting geopolitical headlines regarding U.S.-Iran talks.
- A relief rally was initiated from the 23,800 support level but remains fragile without official confirmation of de-escalation.
- The key upside resistance to watch is the 25,000 level.
- A breakdown below 23,500 would signal a continuation of the downtrend, targeting 23,000.
Trading in a market driven by unpredictable news requires a solid risk management strategy. What's one rule you never break when trading in volatile conditions?
Risk Disclosure: Any opinions, news, research, market analysis, pricing, or other information contained on this website is provided as general market commentary for informational purposes only, and does not constitute investment advice. Aurra Markets shall not accept liability for any loss or damage, including without limitation to, any loss of profit, which may arise directly or indirectly from the use of or reliance on such information.
The Global Asset Hub
Aurra Markets connects you to Forex, Indices, Commodities and Crypto CFDs from a single MT5 account. You get deep liquidity and complete control over your portfolio.
Trade global markets on your terms at www.aurra.markets.
The Official Aurra Markets:
There is only one Aurra. We are defined by our Double-R spelling and our commitment to transparency. ❌ Not a prop firm. ❌ Not affiliated with Aura Capital. ✅ We are a fully registered International Brokerage (Reg: 2025-00208).