Back
Back


Is the NASDAQ Setting a Bullish Trap or a Launchpad?
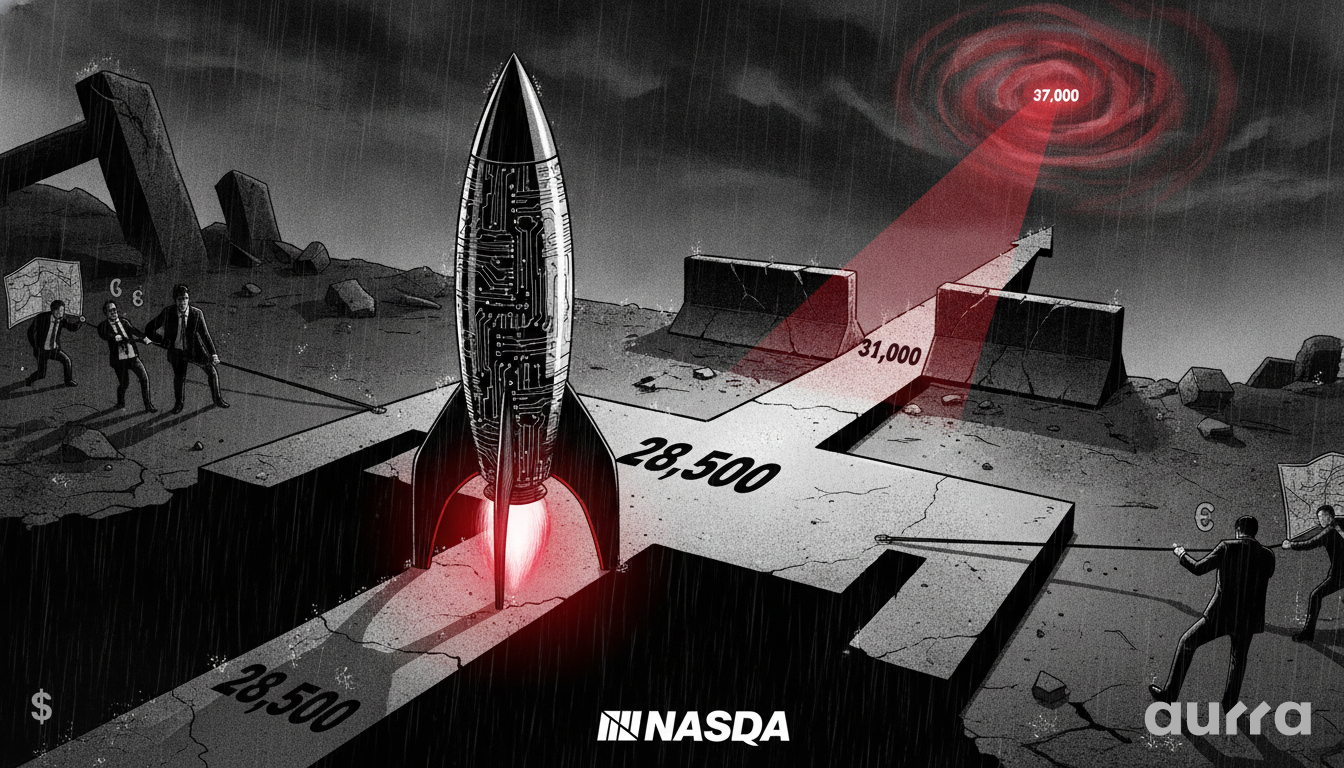
The NASDAQ 100 is currently caught in a technical tug-of-war, with the index coiling within what appears to be a classic bullish flag pattern. This consolidation phase is critical, as a breakout could dictate the market's direction for the coming weeks, presenting a prime opportunity for prepared traders.
Fundamental Drivers: Tech Exceptionalism vs. Macro Headwinds
The current market environment is a fascinating case of conflicting forces. On one hand, we have the powerhouse tech sector, which continues to display remarkable earnings growth and innovation, acting as a natural magnet for capital. On the other hand, persistent geopolitical tensions and the looming shadow of interest rate uncertainty are creating a risk-averse sentiment that keeps bullish ambitions in check. It's this very conflict that is giving rise to the current consolidation pattern, as traders weigh the micro-level strengths of NASDAQ components against the macro-level risks.
The Role of Big Tech
The top ten companies in the NASDAQ 100, such as Apple, Microsoft, and Nvidia, have an outsized influence on the index's performance. Their ability to consistently deliver strong results provides a solid foundation for the index. As long as these titans remain robust, it's difficult to envision a sustained bear market in the NASDAQ, which explains the aggressive buying we're seeing at key support levels. Traders should monitor the upcoming earnings reports from these key players, as any surprises could serve as the catalyst for a breakout.
Interest Rate Sensitivity
Technology stocks, particularly those in high-growth phases, are notoriously sensitive to interest rate fluctuations. The cost of borrowing is a critical factor in their valuation models, and even a slight hawkish pivot from the Federal Reserve could send shockwaves through the NASDAQ. The market is currently pricing in a delicate balance, and any deviation from this expectation will likely result in heightened volatility. This is where managing your trading costs becomes crucial; our platform's highly competitive, low-cost spreads are a direct advantage in such a sensitive environment.
Interest rates move the world. When the Fed or the ECB speaks, trends change instantly. Catching these shifts early is how big moves are caught.
🏛️ Watch the Fed: Don't be surprised by a rate hike. Track all upcoming central bank decisions and monetary policy speeches on the Aurra Economic Calendar.
Technical Outlook: Deconstructing the Bull Flag
From a chart perspective, the NASDAQ's price action is a textbook example of a market taking a breather after a strong upward move. The 'pole' of the flag was the sharp rally we witnessed earlier in the month, and the current sideways consolidation forms the 'flag' itself. This pattern typically resolves in the direction of the prior trend, which in this case is bullish. However, the devil is in the details, and several key levels must be respected.
The Critical Support Zone: 28,500
The 28,500 level has proven to be a formidable floor for the NASDAQ in recent weeks. Each time the price has dipped to this area, buyers have stepped in with conviction, signaling a strong belief in the index's underlying strength. A definitive break below this level would invalidate the bullish flag pattern and could trigger a wave of selling, as it would indicate a significant shift in market sentiment. For those watching this level, setting a price alert on your MetaTrader 5 (MT5) platform is a prudent step.
The 31,000 Resistance Ceiling
On the upside, the 31,000 mark represents the upper boundary of the consolidation channel and the primary obstacle for the bulls. A breakout above this level, particularly on high volume, would confirm the bullish flag and likely ignite a fresh wave of buying. The measured move target for this pattern, as indicated in the source article, sits near the ambitious 37,000 level, offering a substantial potential reward for those positioned correctly. In such a fast-moving scenario, our deep liquidity ensures you can get your orders filled quickly at your desired price points.
⚡ Instant MT5 Transfers
Skip the wait for external payment gateways. You can transfer capital directly from your central funding hub to your live MetaTrader 5 account in milliseconds. Keep your funds ready to execute when market opportunities arise.
Broader Market Impact: A Canary in the Coal Mine?
The NASDAQ's performance is often viewed as a leading indicator for the broader market, given its high concentration of growth-oriented companies. As such, the resolution of this current consolidation pattern could have implications that extend far beyond the tech sector. A bullish breakout would likely fuel a 'risk-on' sentiment across the entire market, potentially lifting other indices like the S&P 500 in its wake. Conversely, a breakdown could signal a looming period of market-wide weakness.
If the 31,000 resistance is decisively broken, traders might anticipate a surge in momentum and should be prepared for a rapid move higher. Before this happens, it would be wise to use our Trading Calculator to model potential trade scenarios and manage your position sizing accordingly.
Key Takeaways
- The NASDAQ 100 is in a bullish flag consolidation pattern.
- Key support is at 28,500; a break below would invalidate the pattern.
- Key resistance is at 31,000; a break above could target 37,000.
- Big tech earnings and interest rate speculation are the primary fundamental drivers.
- The resolution of this pattern could have a significant impact on broader market sentiment.
Given the current consolidation in the NASDAQ, do you believe the next major move will be driven more by tech sector earnings or by macroeconomic data?
Risk Disclosure: Any opinions, news, research, market analysis, pricing, or other information contained on this website is provided as general market commentary for informational purposes only, and does not constitute investment advice. Aurra Markets shall not accept liability for any loss or damage, including without limitation to, any loss of profit, which may arise directly or indirectly from the use of or reliance on such information.
The Aurra Trading Environment
Aurra Markets operates as a digital-first CFD broker. We process trades without traditional banking delays. You can move capital instantly using native crypto deposits and execute positions on MetaTrader 5 in milliseconds.
Experience true market access at www.aurra.markets.
🛡️ Security Verification:
You are trading with Aurra Markets International. We are a distinct, independent financial institution. We are not associated with 'Aura FX', 'Auro Markets', 'Aurora', or 'Aura Funded'. Always verify your URL: Ensure you are connected to the official www.aurra.markets.