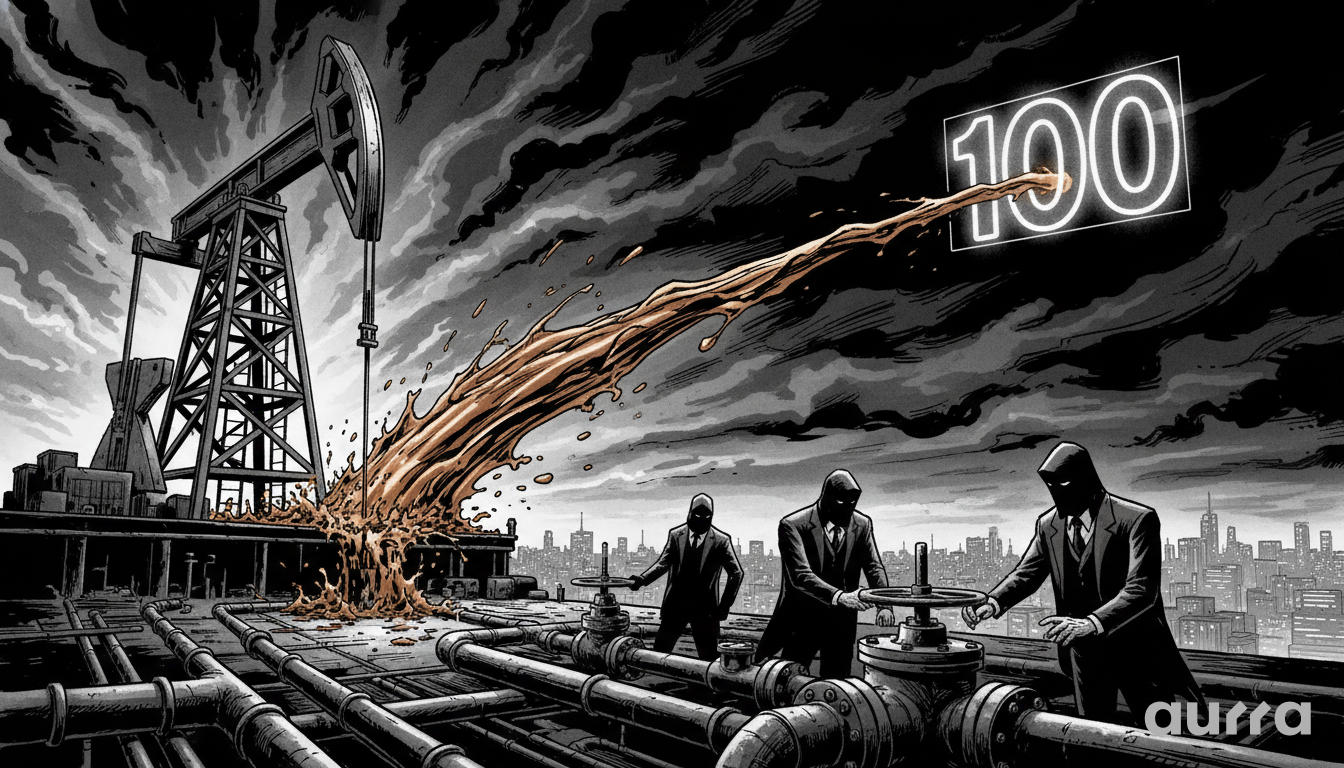
Oil Breaks Out: Is $100 the Next Stop?
The West Texas Intermediate (WTI) crude oil market has staged a powerful rally, decisively breaking above the 50-Day EMA, a key technical indicator of trend. This bullish momentum is being fueled by rising geopolitical tensions in the Middle East, which threaten to disrupt the global supply chain. This breakout signals a significant shift in market sentiment, suggesting that buyers are taking control and setting their sights on higher price levels, most notably the psychological $100 per barrel mark.
While the source analysis correctly highlights the geopolitical risk premium, it's crucial to examine the demand side of the ledger for a complete picture. This rally isn't happening in a vacuum; it's underpinned by resilient global demand signals. For instance, recent inventory reports from the Energy Information Administration (EIA) showing a larger-than-expected drawdown in crude stockpiles would serve as a powerful confirmation that consumption is robust. This confluence of tightening supply fears and surprisingly strong demand creates a much more potent bullish cocktail than either factor alone.
Fundamental Drivers: A Two-Pronged Catalyst
The current strength in the oil market is a function of both supply-side risks and a sturdy demand outlook. This dual support provides a firm foundation for the ongoing rally.
Geopolitical Risk Premium
The persistent back-and-forth between the U.S. and Iran introduces a significant level of uncertainty. Any escalation in the Middle East could jeopardize passage through critical chokepoints like the Strait of Hormuz, through which a vast portion of the world's oil transits. Traders are actively pricing in this risk, and as long as tensions remain high, it provides a supportive floor for prices.
Professional trading is 90% management. Regularly reviewing your withdrawal history and internal transfers is part of good financial hygiene.
🔐 Your Trading Hub: Manage your wallets, open new sub-accounts, or request a withdrawal securely. Access your personal dashboard at Member Login.
The Demand Equation
Stronger-than-anticipated economic data from key economies, particularly the U.S., translates into a more optimistic forecast for energy consumption. This robust demand helps to absorb existing supply, creating a tighter market balance. This is a critical point of confluence: when supply is threatened while demand remains strong, the path of least resistance for prices is upward. Traders can stay on top of these market-moving data releases by regularly consulting our Economic Calendar.
Technical Landscape: The Path to $100
With the break above the 50-Day EMA, the technical picture has cleared significantly for the bulls. The market now appears to be navigating within a well-established long-term range.
Identifying Key Levels
The market appears to be trading within a broad range established back in March, with $85 acting as a solid floor and $115 as the ultimate ceiling. The current breakout positions the market to challenge the upper end of this range, with the $100 psychological level being the first major hurdle. A clean break above this would be a powerful signal of continuation. Any pullbacks are now likely to find initial support at the 50-Day EMA, with the $90 level offering a secondary line of defense.
The market is a global relay race. When the Asian session closes, London opens, followed by New York. Opportunities are flowing 24 hours a day, 5 days a week.
🌍 Trade the World: Don't limit your strategy to just one region. From the opening bell in Tokyo to the close in New York, access every major global session on our Markets page.
Managing Volatility
The oil market is notoriously volatile, and sharp price swings are common. With the current geopolitical backdrop, this volatility can be amplified. Our Trading Calculator is an indispensable tool in this environment, helping you to model potential trade scenarios and manage your position sizing effectively according to your risk tolerance. Whether you are trading on our Standard or ECN account, disciplined risk management is non-negotiable.
Broader Market Context and Strategy
The price of oil is a critical input for the global economy, influencing everything from inflation to corporate earnings. Its recent surge has broader implications that traders must consider.
Inflationary Pressures
A sustained move higher in oil prices can fuel inflation, which in turn could force central banks to maintain a more hawkish stance on interest rates. This creates a complex feedback loop for markets, where a rally in one asset class can create headwinds for others, like equities and bonds.
Actionable 'If/Then' Scenario
If geopolitical tensions escalate further over the coming days, with new threats or military posturing, expect the flight to safety to intensify in the oil market. This could see a swift rally towards the $100 level. Traders should use the advanced charting tools on MetaTrader 5 (MT5) to watch for signs of accelerating momentum. Conversely, any news of a diplomatic breakthrough or de-escalation could see profit-taking, potentially pushing the price back to test the 50-Day EMA as support.
Key Takeaways
- WTI crude oil has broken out above its 50-Day EMA, signaling bullish momentum.
- The rally is driven by a combination of geopolitical supply risks and resilient global demand.
- The psychological $100 per barrel level is the next major upside target for buyers.
- Key support levels to watch on any pullback are the 50-Day EMA and the $90 price zone.
- The oil market's inherent volatility requires disciplined risk management, for which tools like a trading calculator are essential.
Considering the dual catalysts of supply risk and strong demand, what is the most significant factor you are watching that could either accelerate or derail oil's path to $100?
Risk Disclosure: Any opinions, news, research, market analysis, pricing, or other information contained on this website is provided as general market commentary for informational purposes only, and does not constitute investment advice. Aurra Markets shall not accept liability for any loss or damage, including without limitation to, any loss of profit, which may arise directly or indirectly from the use of or reliance on such information.
The High-Volume Standard
Active traders require specific conditions. Aurra Markets International Limited delivers raw spreads and sub-12ms execution. We welcome traders who need absolute precision. You get to maximise your opportunities with our cutting-edge ECN infrastructure.
Test our execution at www.aurra.markets.
🛡️ Security Verification:
You are trading with Aurra Markets International. We are a distinct, independent financial institution. We are not associated with 'Aura FX', 'Auro Markets', 'Aurora', or 'Aura Funded'. Always verify your URL: Ensure you are connected to the official www.aurra.markets.