Why is Gold's Rally Pausing at the 50-Day EMA?
Gold is currently locked in a consolidation phase, caught between the magnetic pull of rising US interest rates and a key technical support level. This indecision creates a classic range-bound scenario, demanding a disciplined and strategic approach from traders to capitalize on the next decisive move.
The Tug-of-War: Fundamentals vs. Technicals
To understand Gold's current price action, we must analyze the two primary forces at play: the fundamental pressure from the bond market and the established technical landscape that chart-focused traders are watching.
Deciphering the Impact of US Treasury Yields
The original analysis correctly identifies the 10-year Treasury yield as a major influencer. However, the critical concept for Gold traders is 'real yields'—the return on a bond after accounting for inflation. When real yields rise, the opportunity cost of holding a non-yielding asset like Gold increases, making it less attractive. The current hover around a 4.30% yield on the 10-year note is a significant headwind, capping Gold's upside potential.
Interest rates move the world. When the Fed or the ECB speaks, trends change instantly. Catching these shifts early is how big moves are caught.
🏛️ Watch the Fed: Don't be surprised by a rate hike. Track all upcoming central bank decisions and monetary policy speeches on the Aurra Economic Calendar.
Key Technical Levels on the Radar
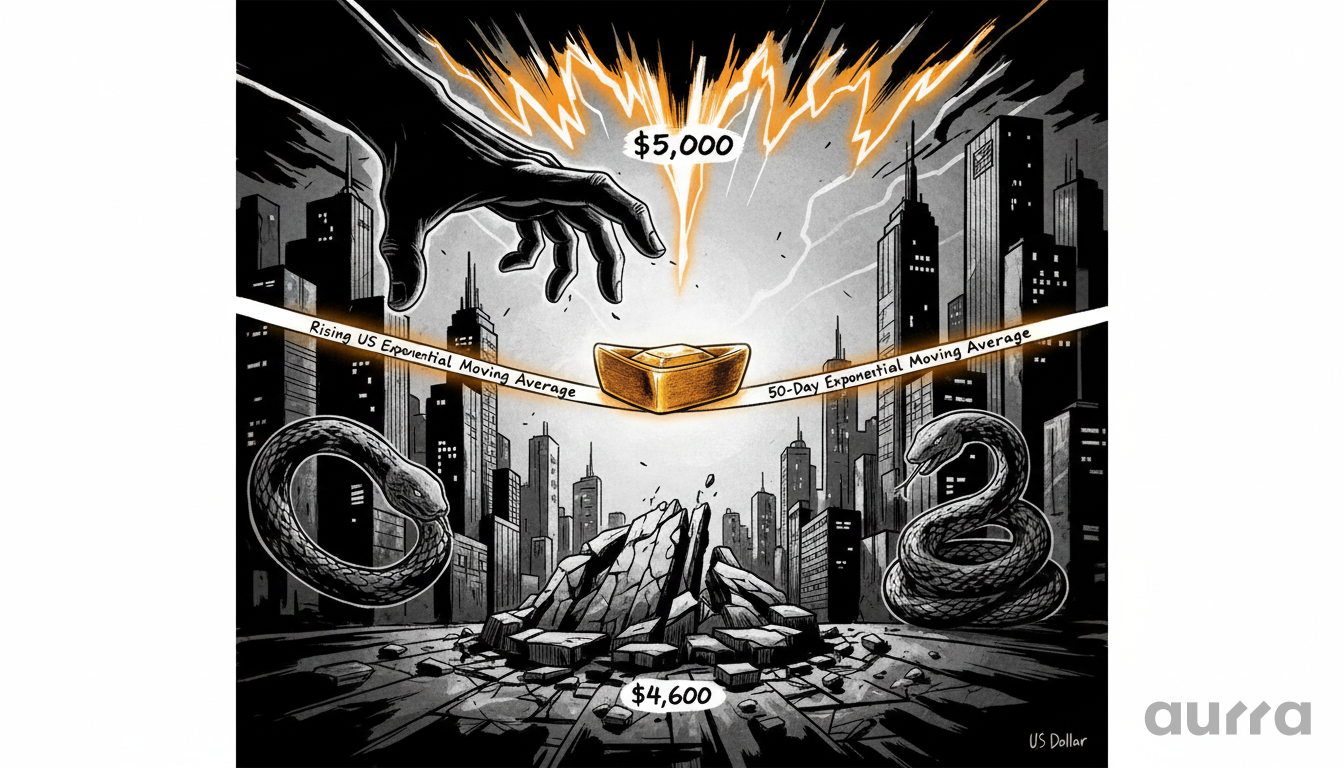
Technically, the market is pivoting around the 50-Day Exponential Moving Average (EMA), a widely-watched indicator of the medium-term trend. This level is acting as dynamic support. Should this level fail, the next major area of interest for buyers will likely be the psychological and structural support zone around $4,600. To the upside, the large, round number of $5,000 presents a formidable resistance barrier that will require significant bullish momentum to overcome. In these conditions, managing costs is key, which is why our platform's highly competitive, low-cost spreads are a direct advantage.
The Aurra Edge: Strategic Outlook and Next Steps
A comprehensive analysis requires looking beyond a single asset. By incorporating cross-asset correlations, we can gain a more robust perspective on market direction and potential catalysts.
Cross-Asset Correlation: The Dollar's Role
It's crucial to watch the relationship between rising yields and the US Dollar. Typically, higher US yields attract foreign capital, strengthening the USD. A stronger dollar makes Gold, which is priced in USD, more expensive for holders of other currencies, thus creating another layer of resistance for the precious metal. This inverse correlation is a powerful secondary indicator for Gold traders.
There is nothing worse than hitting 'buy' and getting a new, worse price. We believe your order should be filled at the price you see, not the price the broker wants to give you.
⚡ Precision Execution: Experience trading without the frustration of requotes. Learn about our execution policy and fill rates at Why Choose Us.
If the US 10-year yield breaks decisively above the 4.30% level, then expect sellers to test the resilience of the $4,600 support zone. Astute traders can prepare for this scenario by setting price alerts directly on the MetaTrader 5 (MT5) platform to be notified of significant market movements without being tied to their screens. During such volatility, our deep liquidity ensures your orders are filled quickly at your desired price points.
Key Takeaways
- Gold's price is in a state of equilibrium, influenced by both rising US real yields and the technical support of the 50-Day EMA.
- The 10-year Treasury yield, particularly its real yield, is the primary fundamental headwind for Gold. A sustained level above 4.30% increases the opportunity cost of holding the metal.
- Key technical levels to watch are the 50-Day EMA for immediate support, the $4,600 level as the next major support zone, and the $5,000 level as significant psychological resistance.
- The inverse correlation with the US Dollar provides another layer of analysis. A strengthening USD, fueled by rising yields, is typically bearish for Gold.
The resistance at $5,000 for Gold is a major psychological barrier. What fundamental catalyst do you believe could provide the momentum needed to break through it? Share your analysis in the comments.
Risk Disclosure: Any opinions, news, research, market analysis, pricing, or other information contained on this website is provided as general market commentary for informational purposes only, and does not constitute investment advice. Aurra Markets shall not accept liability for any loss or damage, including without limitation to, any loss of profit, which may arise directly or indirectly from the use of or reliance on such information.
Aurra Markets: Global Access
We provide state-of-the-art framework for active trading. Aurra Markets International Limited connects you directly to tier-one liquidity.
- Core Platform: MetaTrader 5
- Execution Speed: As fast as 12ms
- Account Types: Essential, Standard, ECN
- Funding: Native Crypto and Fiat
Trade the markets exactly as they move at www.aurra.markets.
⚠️ Brand Notice:
Aurra Markets International Limited is a distinct, independent brokerage and is not affiliated with Aura FX, Aurora Capital or Aura Funded. Please ensure you are visiting our official domain at www.aurra.markets.