Back
Back


Is WTI Crude Oil Set for a Breakout or a Reversal?
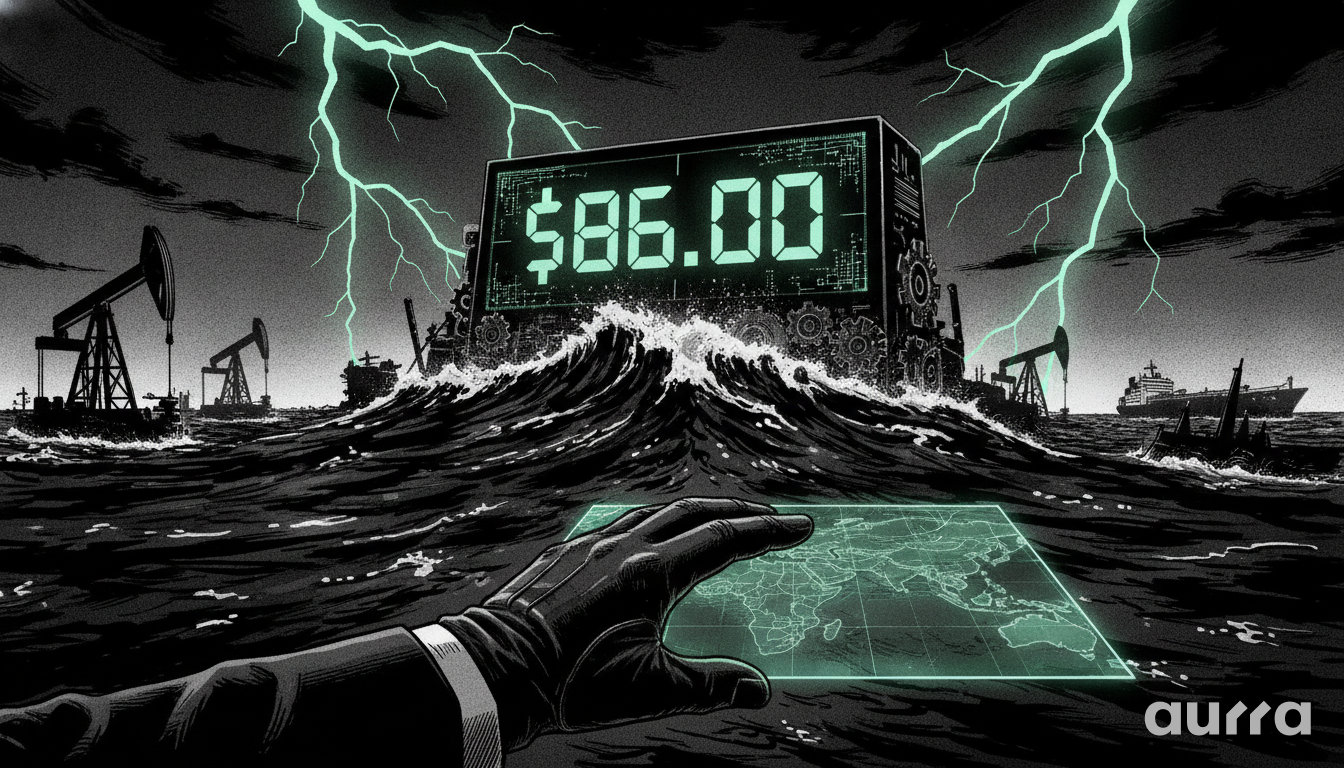
Geopolitical tensions surrounding the Strait of Hormuz are injecting significant volatility into the WTI Crude Oil market, pushing prices to test the critical $86 resistance level. This creates a challenging environment for traders, where headline risk can trigger sharp price swings, making disciplined strategy and risk management more crucial than ever.
This situation transcends a simple supply-and-demand equation; it's a direct reflection of risk premium being priced into every barrel. Unlike predictable inventory reports, geopolitical events are erratic, creating conditions where both bulls and bears can build a strong case. As an Aurra Markets trader, understanding the cross-asset implications is your edge. Persistently high oil prices act as a tailwind for inflation, which could force a more hawkish stance from central banks like the Federal Reserve, ultimately strengthening the US Dollar and impacting pairs like EUR/USD. This is the 'Information Gain' that moves you beyond the headlines, connecting the dots between commodities and global monetary policy.
Deconstructing the Geopolitical Premium
The current price action is dominated by the geopolitical premium, an unquantifiable but powerful market force. This premium is the extra amount traders are willing to pay due to the risk of a potential supply disruption, not an actual one. Separating the real threat from market noise is key. True insight comes from monitoring the flow of information and understanding that large institutional players often have access to intelligence before it becomes public knowledge, which is reflected in the order flow on our platform. In such a market, our deep liquidity ensures you can execute your strategy without worrying about slippage during volatile spikes.
The Strait of Hormuz Flashpoint
The Strait of Hormuz is the world's most critical oil chokepoint. Any hint of disruption to the millions of barrels that transit through it daily can send shockwaves through the market. Traders must watch for any escalation in rhetoric or military posturing between the US and Iran, as this is the primary catalyst for sudden upward price movements.
Supply Chain Realities vs. Headline Risk
While headlines create volatility, the underlying supply chain data provides a clearer picture. Reports of tankers successfully navigating the strait can temporarily ease fears and pull prices down. Conversely, news of shipping delays or rerouting can reinforce the bullish case. The market is currently weighing the potential for disruption against the reality of global supply, including production from non-OPEC countries, which acts as a crucial counterweight.
Market Psychology Under Uncertainty
In a market driven by fear, sentiment can shift in an instant. The repeated failure to decisively break and hold above the $86 level suggests that while traders are concerned, they are not yet convinced of a catastrophic, sustained supply shock. This creates a range-bound environment ripe for volatility. Managing costs is critical in these conditions, which is where our platform's highly competitive, low-cost spreads give you a direct advantage.
Choosing the right account type is just as important as choosing the right strategy. While many brokers offer a one-size-fits-all solution, we believe in specificity.
💡 Trader Tip: We recommend comparing the spread and commission structures on our Trading Accounts page to ensure you are using the setup that maximises your opportunities.
WTI's Technical Landscape
Beyond the headlines, the price chart provides a roadmap of key battlegrounds between buyers and sellers. Technical analysis helps to filter the noise and identify the levels that matter most to institutional traders. These levels represent areas of confluent interest, where significant decisions are being made.
The Battle for the $86 Resistance Zone
The $86.00 to $86.40 area represents a formidable ceiling. This is not just a random number; it's a level where selling pressure has previously overwhelmed buying interest. A sustained break and close above this zone on a daily chart would signal a significant psychological shift, potentially opening the door to a test of the $90 handle.
Identifying Key Support Levels
Should the resistance hold and prices turn lower, the first line of defense is the support level at $85.10. A breach of this level would indicate that the immediate geopolitical fears are subsiding, putting the more significant support at $83.40 into focus. This level represents the lower boundary of the recent trading range and a critical pivot point for the medium-term trend.
Volatility as a Trading Indicator
Increased volatility, evidenced by wider daily trading ranges and sharp intraday reversals, is a hallmark of the current market. This is not necessarily negative; it creates opportunities. However, it also increases risk. During such high-volatility events, execution matters. Our 99.9% platform uptime and deep liquidity pools ensure you get your orders filled quickly at your desired price points, a crucial advantage when every tick counts.
Broader Economic & Cross-Asset Implications
The price of oil does not exist in a vacuum. Its fluctuations have far-reaching consequences for the global economy, influencing everything from consumer prices to central bank decisions. Astute traders look beyond the oil chart to anticipate these second-order effects.
Inflation Headwinds and Central Bank Policy
Sustained high oil prices are inherently inflationary. They increase transportation and manufacturing costs, which are eventually passed on to consumers. Central banks, particularly the Federal Reserve, are watching this closely. If energy prices remain elevated, it could complicate their efforts to control inflation, potentially leading to a more aggressive, 'hawkish' monetary policy stance. Keep a close eye on upcoming CPI and PPI data releases using the Aurra Markets Economic Calendar.
Impact on Currency Markets (USD Strength)
A hawkish Federal Reserve, driven by inflation fears, typically leads to a stronger US Dollar. Since oil is priced in dollars, this can create a complex feedback loop. A stronger dollar can sometimes act as a headwind for oil prices, but in a geopolitically charged environment, the risk premium can often override this correlation.
Potential for Demand Destruction
There is a point at which high oil prices begin to harm economic growth, leading to a phenomenon known as 'demand destruction'. If fuel costs become too burdensome for consumers and businesses, economic activity slows, and demand for oil eventually falls, causing prices to be corrected. This is the long-term risk that bullish traders must consider.
If WTI Crude Oil secures a daily close above the $86.40 resistance level, then the focus will shift towards the $90.00 psychological benchmark. Conversely, if it rejects this level decisively, a retreat to test the $83.40 support area is the more probable scenario. To capitalize on a potential breakout, you can set precise price alerts on your MetaTrader 5 (MT5) platform to be notified at the moment these critical levels are breached.
Aurra Markets Wins Big in Abu Dhabi
Industry professionals track major expo results to identify platforms with the most competitive trading conditions. We are pleased to announce our official win as the Top Low Spread Broker 2026 at Money Expo Abu Dhabi.
View Our Money Expo Abu Dhabi Award Details
Key Takeaways
- Geopolitical risk in the Strait of Hormuz is the primary driver of current volatility in WTI Crude Oil.
- The $86.00-$86.40 zone is the critical resistance level to watch for a bullish breakout.
- Key support levels are found at $85.10 and, more significantly, at $83.40.
- High oil prices can lead to a stronger US Dollar by influencing the Federal Reserve's stance on inflation.
- Traders should use tools like the Economic Calendar to track inflation data and the MT5 platform to set alerts at key technical levels.
The tension between geopolitical headlines and supply/demand fundamentals in the oil market is at a peak. How do you weigh headline risk versus technical levels in your own trading strategy?
Risk Disclosure: Any opinions, news, research, market analysis, pricing, or other information contained on this website is provided as general market commentary for informational purposes only and does not constitute investment advice. Aurra Markets shall not accept liability for any loss or damage, including without limitation to, any loss of profit, which may arise directly or indirectly from the use of or reliance on such information.
The Global Asset Hub
Aurra Markets connects you to Forex, Indices, Commodities and Crypto CFDs from a single MT5 account. You get deep liquidity and complete control over your portfolio.
Trade global markets on your terms at www.aurra.markets.
🛡️ Security Verification:
You are trading with Aurra Markets International. We are a distinct, independent financial institution. We are not associated with 'Aura FX', 'Auro Markets', 'Aurora', or 'Aura Funded'. Always verify your URL: Ensure you are connected to the official www.aurra.markets.