Is NVIDIA's Breakout a Bull Trap or the Real Deal?
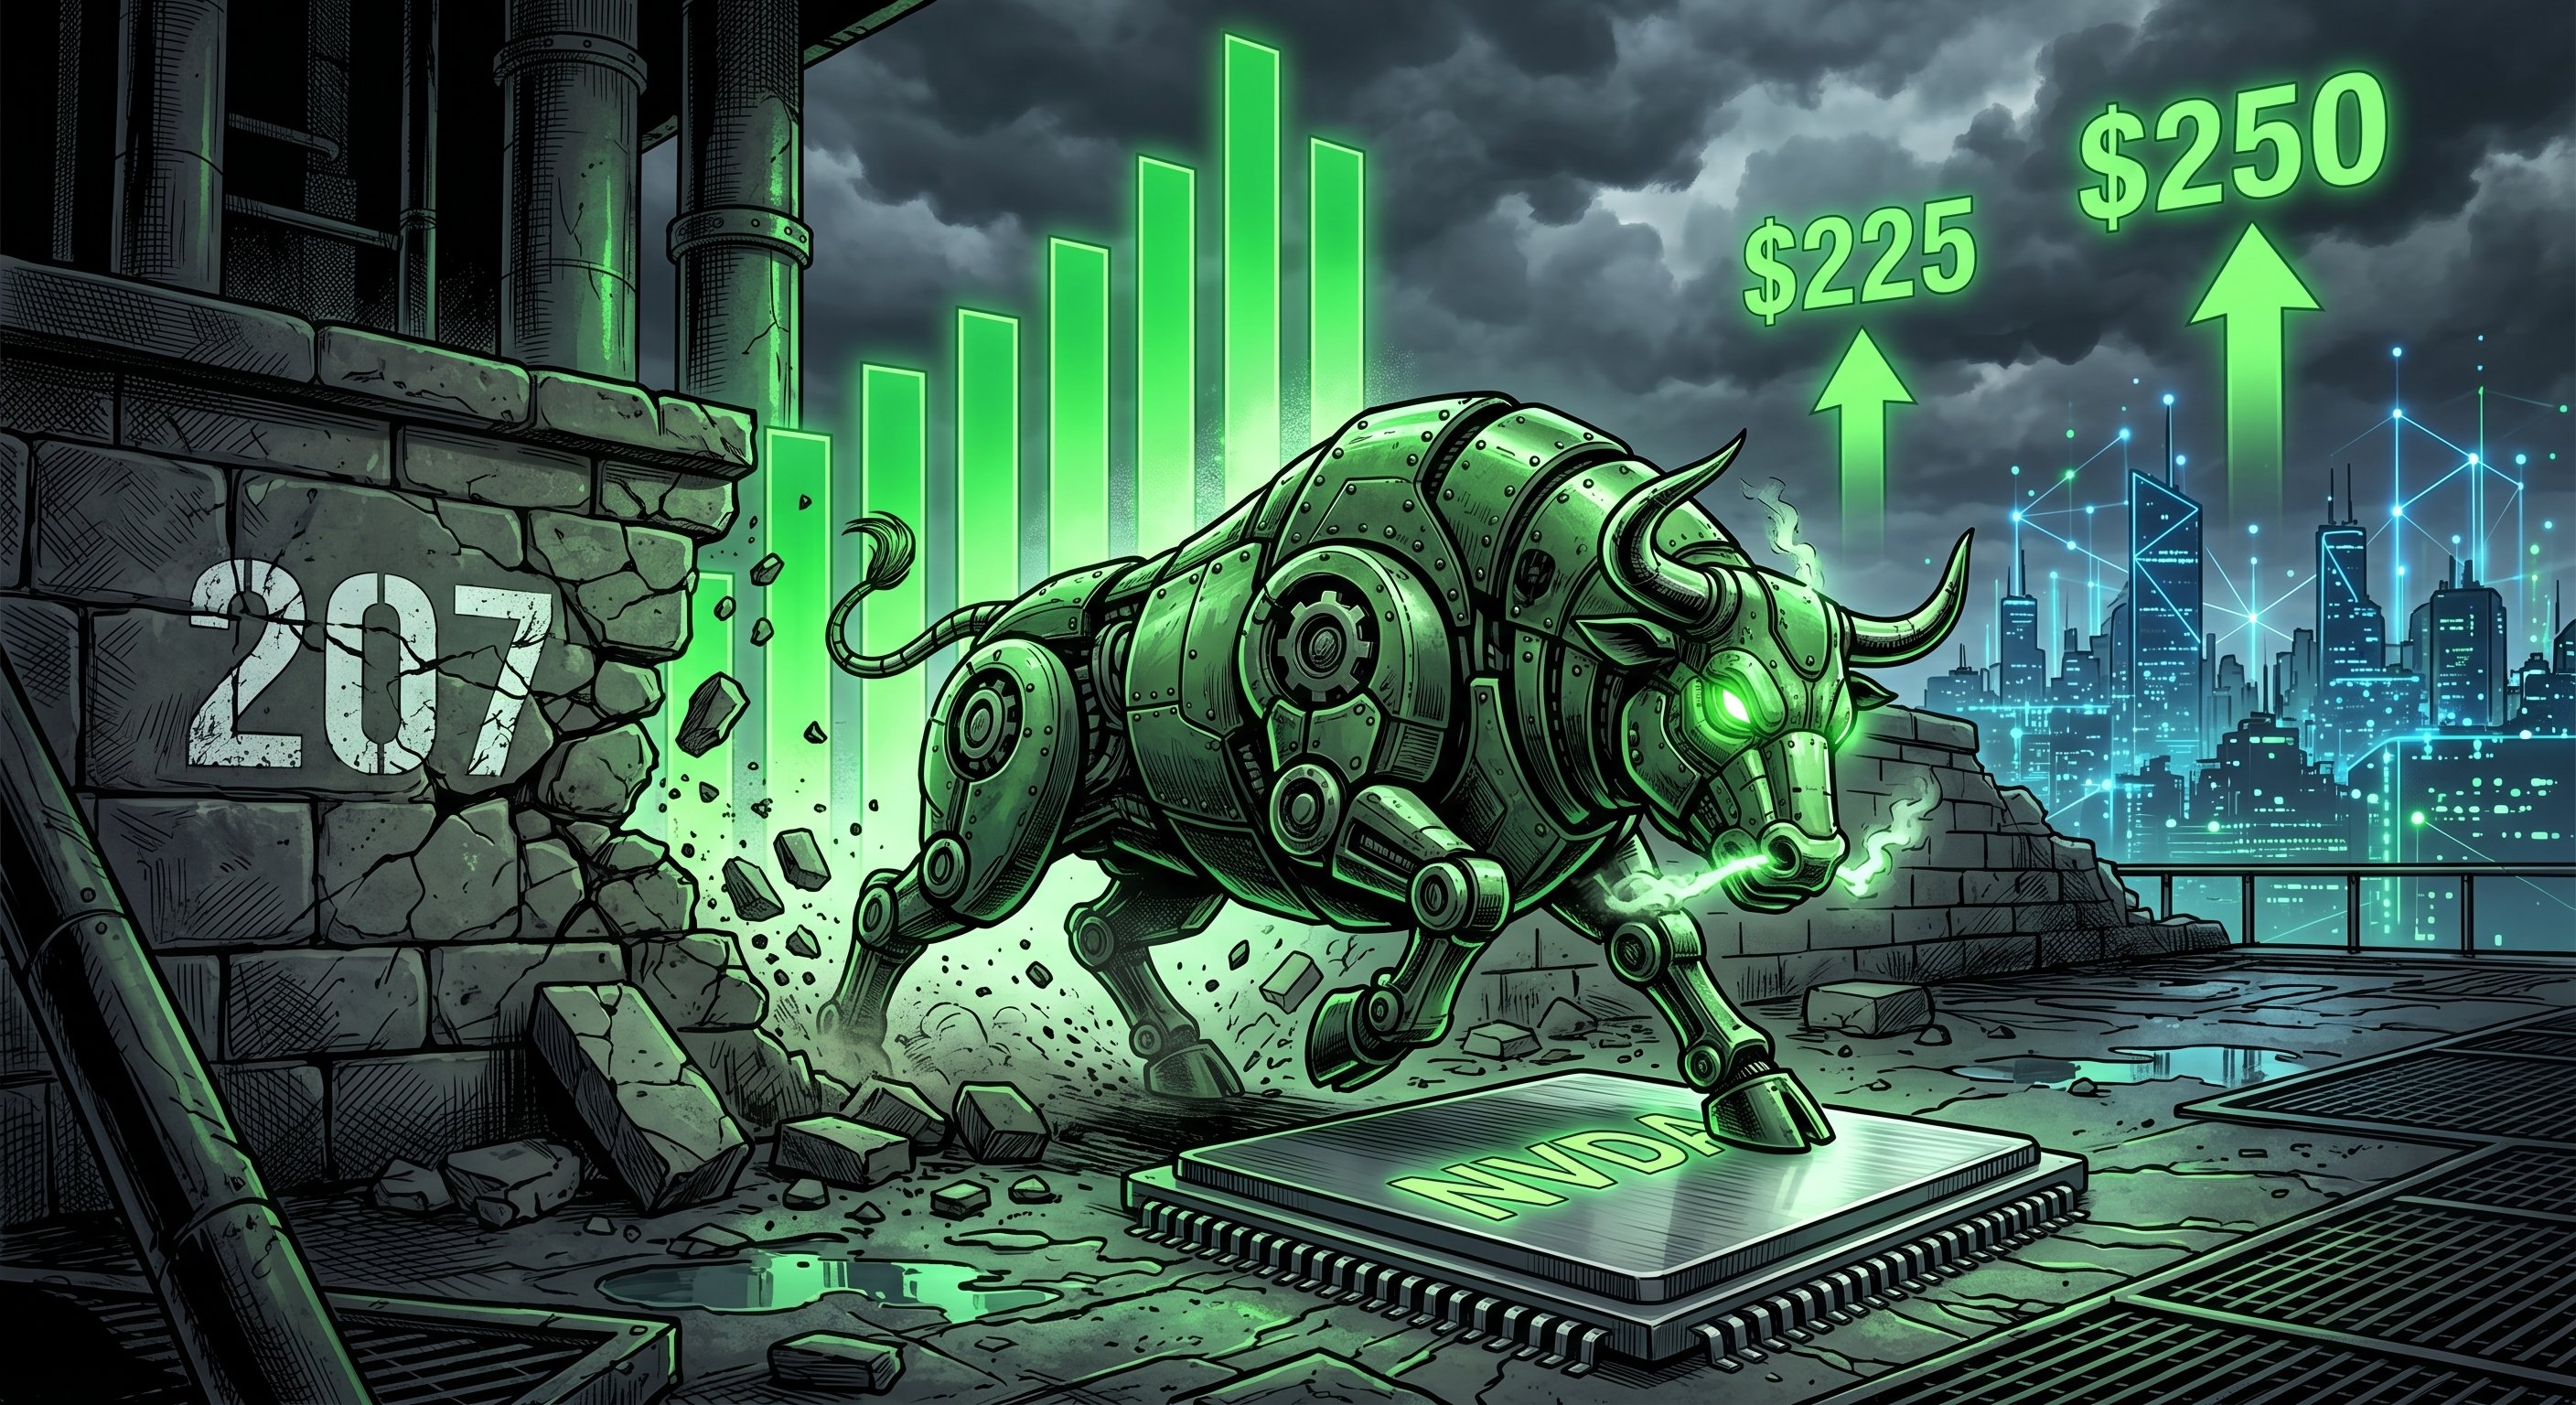
NVIDIA's stock has surged to a new all-time high, breaking past the key $207 resistance level. This powerful breakout signals strong bullish momentum, creating a critical decision point for traders navigating the high-flying tech sector.
The current price action is reminiscent of the post-earnings breakout in Q4 2025, where a period of consolidation was followed by a sharp, volume-backed rally. The key difference now is that NVIDIA is in "blue-sky territory," meaning there is no historical resistance to act as a clear brake on the price. This makes psychological round numbers, like $225 and $250, the next logical areas of interest for profit-taking.
There is nothing worse than hitting 'buy' and getting a new, worse price. We believe your order should be filled at the price you see, not the price the broker wants to give you.
⚡ Precision Execution: Experience trading without the frustration of requotes. Learn about our execution policy and fill rates at Why Choose Us.
Anatomy of a Breakout: Reading the Tape
This breakout isn't just a number on a chart; it's a story of market conviction. The move was confirmed by a significant uptick in trading volume, suggesting institutional capital is flowing in, not just retail excitement. In such scenarios, managing costs is paramount as volatility increases, which is why our platform's highly competitive, low-cost spreads are a direct advantage for traders looking to capitalize on these sharp moves.
From Resistance to Support: The New Battleground
The prior resistance level around **$207** has now become the new critical support zone. For this bullish trend to remain valid, buyers must defend this level on any subsequent pullback. A failure to hold here would be the first red flag, potentially signaling a "look above and fail" pattern—a bearish reversal setup.
The Broader Market Context: NASDAQ and the SOX Index
**NVIDIA's** strength is not happening in a vacuum. It is a lead indicator for the broader **NASDAQ 100** and the Philadelphia Semiconductor Index (SOX). As long as NVDA leads, it provides a bullish tailwind for the entire tech sector. Traders must watch this correlation; a sudden reversal in NVDA could foreshadow a wider market pullback.
If **NVIDIA** successfully holds the **$207** level as new support on a closing basis, the path of least resistance points towards higher valuations. Traders should consider using the Fibonacci extension tool from the recent lows to project potential upside targets. For precise entry and exit timing during such high-volatility events, execution matters; our deep liquidity ensures you get your orders filled quickly at your desired price points. You can set up price alerts for these key levels directly on the MetaTrader 5 (MT5) platform to stay ahead of the next move.
New and professional traders have different needs. You shouldn't be forced into a complex commission structure if you are just starting out.
⚖️ Find Your Fit: From the zero-commission Standard Account to the institutional-grade ECN Account, we have a setup for every level. Choose your ideal structure on our Trading Accounts dashboard.
Key Takeaways
- **NVIDIA (NVDA)** has broken its all-time high, entering price discovery mode.
- The previous resistance at **$207** is now the most critical support level to watch.
- The breakout is supported by high volume, indicating strong institutional interest.
- **NVDA's** performance is a key indicator for the health of the **NASDAQ 100** and the semiconductor industry (SOX).
- Psychological round numbers ($225, $250) are the next likely upside targets.
With NVIDIA entering new territory, what technical indicators do you find most useful for managing risk in a breakout scenario? Share your strategies in the comments.
Risk Disclosure: This material is provided as general market commentary and does not constitute independent financial research or investment advice. The information presented does not take into account your personal financial objectives, situation, or needs.
Trading Contracts for Difference (CFDs) on margin carries a high level of risk and is not suitable for all investors. The high degree of leverage can work against you as well as for you. You may lose some or all of your initial deposit.
Any historical data, chart patterns, or past performance referenced in this analysis are not reliable indicators of future market behavior.
Aurra Markets and its affiliates accept no liability for any direct or indirect trading losses arising from the use of or reliance on this information. You should seek advice from an independent financial advisor before making any investment decisions.
Aurra Markets International Limited
Execution speed dictates profitability. Aurra Markets is a CFD broker built strictly for performance. We strip away high fees and slow servers. You get raw spreads, MT5 integration and immediate crypto funding.
Verify our live conditions at www.aurra.markets.
⚠️ Brand Notice:
Aurra Markets International Limited is a distinct, independent brokerage and is not affiliated with Aura FX, Aurora Capital or Aura Funded. Please ensure you are visiting our official domain at www.aurra.markets.