Back
Back


Will AI IPO Frenzy Push the NASDAQ Through Resistance?
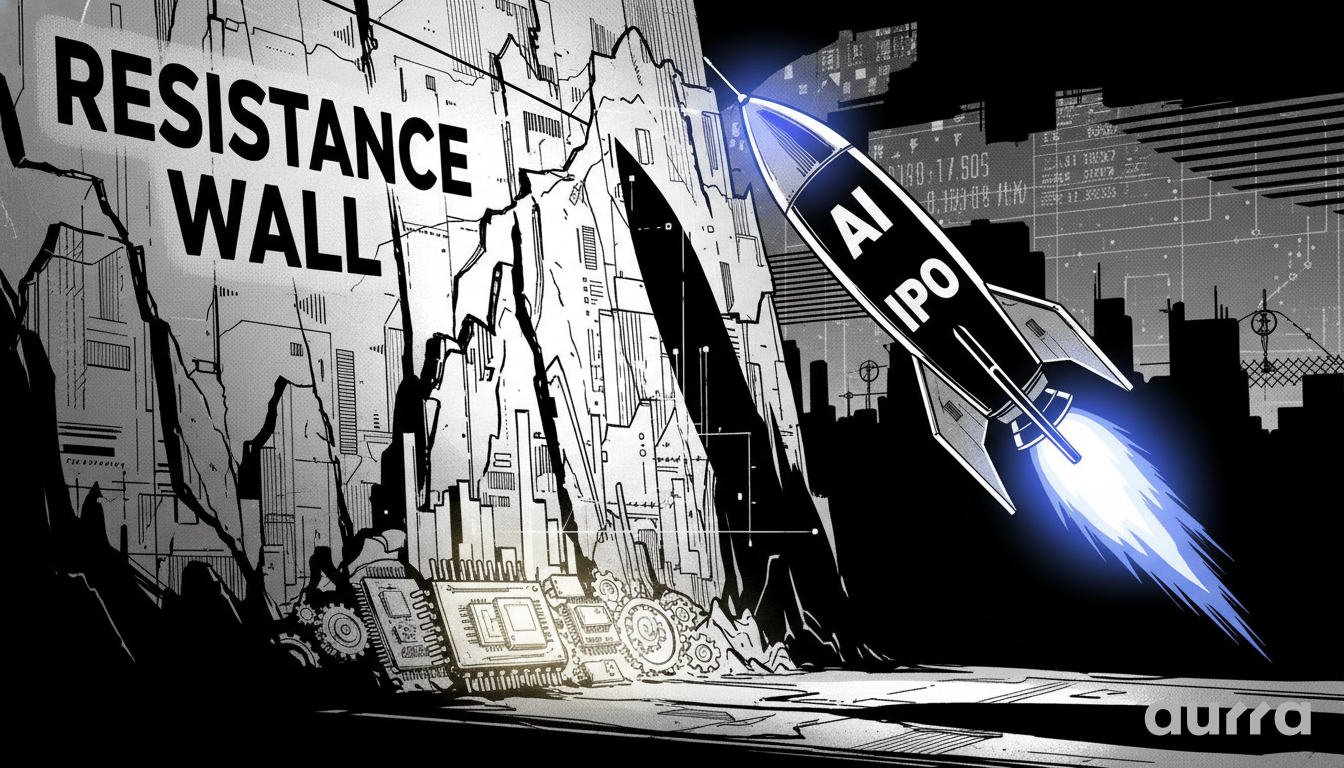
The NASDAQ 100 is pressing against a significant technical resistance zone, buoyed by a powerful narrative of potential high-profile AI IPOs from giants like SpaceX and OpenAI. This has created a critical inflection point for traders, as a confirmed breakout could unleash the next major leg up, while a rejection could initiate a much-needed tactical pullback.
Unlike the dot-com bubble, which was fueled by speculative metrics, the current AI rally is underpinned by tangible, massive infrastructure demand. This historical precedent suggests a more fundamentally sound basis for the rally; however, it does not eliminate the short-term risks of an over-extended market. The concurrent strength in semiconductor stocks, the "picks and shovels" of this AI gold rush, further validates the underlying demand, making the current technical battleground even more significant for market direction.
Fundamental Drivers: Beyond the Hype Cycle
The market is currently weighing the powerful forward-looking narrative of AI against immediate geopolitical and macroeconomic factors. While the prospect of new, high-quality technology companies going public provides a strong tailwind, traders must also consider underlying risks that could temper enthusiasm and create volatility.
The New AI Industrial Revolution
The excitement surrounding potential IPOs from SpaceX, OpenAI, and Anthropic is more than just a speculative froth. These companies represent a new industrial backbone, driving real-world demand for cloud computing, data centers, and high-performance chips. This creates a tangible demand floor that differentiates the current environment from previous tech bubbles, offering a compelling long-term bullish case that supports investor sentiment even during short-term pullbacks.
Semiconductors as a Leading Indicator
The notable strength in semiconductor stocks like Micron serves as a powerful confirmation of the AI narrative's legitimacy. These companies are direct beneficiaries of the AI infrastructure build-out. When chip stocks and the broader NASDAQ index rally in unison, it signals that the market's risk appetite is grounded in the real-world supply chain, not just abstract concepts. This provides a layer of confidence for traders betting on continued technological leadership.
Geopolitical Crosscurrents
While the AI story dominates headlines, secondary geopolitical narratives, such as the potential for a deal with Iran, introduce an element of uncertainty. Such events can impact broader market sentiment and risk appetite, potentially creating headwinds for risk assets like the NASDAQ. While not the primary driver, these factors should be monitored as they can trigger unexpected volatility, underscoring the importance of a robust risk management framework.
Need to reset your MT5 password or create a new sub-account for a different strategy? You don't need to contact support; you have full control.
⚙️ Instant Control: Manage your leverage, create new demo/live accounts, or reset your trading passwords instantly via the Client Login Dashboard.
Technical Outlook: Mapping the Key Battlegrounds
Price action confirms the narrative, and the NASDAQ is currently at a technical crossroads. The index has shown impressive strength, but it is now confronting a well-defined resistance area where sellers have previously emerged. Analyzing these key levels is crucial for determining entry, exit, and risk management points.
The Critical Resistance Zone: 30118-30159
This price range represents the most significant immediate obstacle for NASDAQ. A failure to gain acceptance above this zone would suggest that the bullish momentum is waning and that the market may need to consolidate or pull back to attract new buyers. Conversely, a decisive break and hold above 30162 would act as a major technical breakout, signaling a potential continuation of the primary uptrend and targeting higher price levels.
Identifying Support for Pullback Scenarios
Should the resistance hold, the first key level of tactical support lies between 30040-30075. This area will likely be defended by short-term bulls. A break below this zone would increase the probability of a deeper correction, with the next major support level at 29996. This level is critical; a failure to hold it would confirm a short-term bearish shift and open the door to a more significant pullback.
Volume and Momentum Analysis
A true breakout above 30162 must be accompanied by strong trading volume to be considered valid. High volume would indicate conviction from institutional buyers and reduce the likelihood of a "false breakout." Traders should also monitor momentum indicators like the RSI; a breakout without overbought readings would suggest there is still plenty of room for the rally to run, adding confidence to long positions.
Broader Market Impact and Trader Strategy
The NASDAQ's performance does not occur in a vacuum. Its price action has implications for the entire market, and a sound trading strategy involves understanding these relationships and managing risk effectively, especially in environments where costs can erode profits.
Cross-Asset Correlation: NASDAQ vs. Russell 2000
It is crucial to observe the performance of NASDAQ 100 relative to broader indices like the Russell 2000, which represents smaller-cap domestic companies. If the NASDAQ is rallying, but the Russell 2000 is lagging, it indicates that market strength is concentrated in a few mega-cap names rather than being broad-based. This divergence can be a warning sign of a narrowing market, which can sometimes precede a wider correction.
Managing Costs in a Trending Market
In a market defined by clear technical levels, precise execution is paramount. Even small price movements can be significant, and managing transaction costs is a key component of long-term profitability. In these conditions, Aurra Markets' highly competitive, low-cost spreads are a direct advantage, allowing traders to capitalize on opportunities without sacrificing their edge to high fees.
The 'If/Then' Scenario for the Next Session
The path forward is contingent on the market's reaction to the critical 30162 resistance level. If the NASDAQ breaks and holds above this price, then the bullish trend is likely to accelerate, attracting fresh buying interest. This scenario provides a clear signal for trend-following strategies. To capitalize on this, traders should have a plan in place. You can set up price alerts for this key level directly on the MetaTrader 5 (MT5) platform to ensure you are notified the moment a breakout occurs, allowing for swift and efficient execution.
We are more than just a local broker; we are a global financial hub connecting traders from Asia, LATAM and beyond to the world's liquid markets.
🌏 A Global Community: Join thousands of traders worldwide who trust our infrastructure. Learn more about our global presence at About Us.
Key Takeaways
- The NASDAQ is at a critical resistance point (30118-30159) driven by AI IPO enthusiasm.
- Unlike past bubbles, this rally is supported by tangible infrastructure demand from AI leaders.
- A breakout above 30162 could signal a new bullish leg, while failure could lead to a pullback toward 30040 or 29996.
- Strength in semiconductor stocks validates the underlying fundamental narrative.
- Effective trading in this environment requires precise execution and managing costs, highlighting the value of low-cost spreads.
The current market presents a fascinating battle between a powerful narrative and key technical resistance. How do you weigh the long-term AI story against the short-term risk of a pullback at these levels?
Risk Disclosure: This material is provided as general market commentary and does not constitute independent financial research or investment advice. The information presented does not take into account your personal financial objectives, situation, or needs.
Trading Contracts for Difference (CFDs) on margin carries a high level of risk and is not suitable for all investors. The high degree of leverage can work against you as well as for you. You may lose some or all of your initial deposit.
Any historical data, chart patterns, or past performance referenced in this analysis are not reliable indicators of future market behavior.
Aurra Markets and its affiliates accept no liability for any direct or indirect trading losses arising from the use of or reliance on this information. You should seek advice from an independent financial advisor before making any investment decisions.
Aurra Markets: Institutional Execution
Access raw spreads and fast execution speed as fast as 12ms on the MetaTrader 5 platform. We offer direct Crypto and Fiat funding for fast market entry. No hidden fees. No requotes.
Visit the official site at www.aurra.markets.
Trade with the Real Aurra.
Don't confuse legacy brands with future tech. Aurra Markets (www.aurra.markets) stands alone as the premier destination for MT5 & Crypto-native trading.