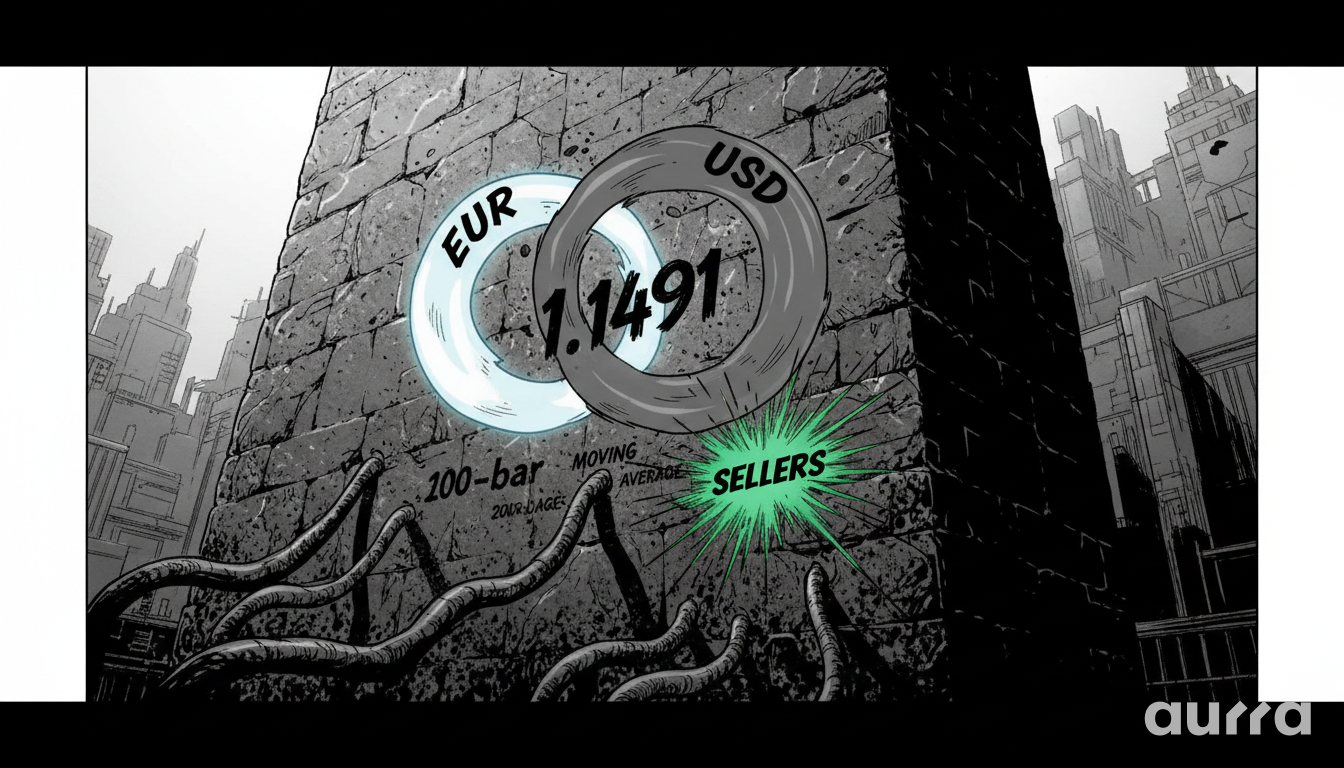
Why is EUR/USD Failing at Key Resistance?
The EUR/USD has demonstrated a clear bearish structure after its recent corrective rally was decisively rejected at a critical resistance zone. The pair's inability to overcome the 1.1491 level, a previous support area from November 2025, confirms that sellers remain firmly in control of the short-term trend. This price action provides a textbook example of a support-turned-resistance scenario, offering valuable insight into the current market sentiment.
What Technical Indicators Are Confirming the Bearish Bias?
Beyond the key horizontal resistance level, several other technical factors are aligning to reinforce the negative outlook for EUR/USD. These indicators, which can be easily layered onto your charts in MetaTrader 5 (MT5), are providing a multi-faceted view of the seller dominance in the market.
How Are Moving Averages Guiding Short-Term Traders?
On the 5-minute chart, the 100-bar and 200-bar moving averages are acting as a dynamic ceiling for the price. The repeated failure of the price to sustain any move above these averages is a strong signal that short-term momentum is to the downside. Each rejection reinforces the moving averages as a reliable area of resistance, attracting more sellers and building a stronger case for further declines. In these conditions, managing costs is key, which is why our platform's highly competitive, low-cost spreads are a direct advantage.
Successful trading isn't just about picking the right direction; it is about sizing your position correctly. Entering a trade without knowing your exact risk exposure is a gamble, not a strategy.
🧮 Manage Your Risk: Eliminate the guesswork before you click 'buy.' Calculate your exact margin requirements, pip value and potential profit with our free Trading Calculator.
What Do Recent Lows Indicate About Market Structure?
The initial sell-off pushed the EUR/USD to its lowest level since August 2025, breaking through several important prior lows. This break of market structure is significant because it signals a continuation of the broader downtrend. The corrective bounce, while sharp, was not strong enough to challenge the bearish structure, and its failure at resistance now opens the door for a potential retest of those new lows.
What is the Strategic Outlook for EUR/USD Traders?
Given the confluence of technical signals, the path of least resistance for EUR/USD appears to be to the downside. However, disciplined trading requires more than just a directional bias; it requires a clear plan for entry, exit, and risk management. This challenging environment is an excellent opportunity to practice patience and precision.
What Would It Take to Shift the Bias to Bullish?
For the current bearish bias to be invalidated, buyers would need to generate enough momentum to push the price decisively back above the cluster of resistance. This means not only clearing the 1.1491 level but also breaking and holding above the 100 and 200-bar moving averages. Such a move would signal a significant shift in control from sellers to buyers. Traders can set price alerts for this zone on the MT5 platform to be notified of such a change.
Volatility creates opportunity, but it also creates risk. The biggest market moves often happen during high-impact news releases like the NFP or CPI data and being unaware of them can lead to unnecessary losses.
📅 Stay Ahead of the News: Don't let a sudden spike stop you out. Track upcoming events, consensus forecasts and release times on the official Aurra Economic Calendar.
How Should Risk Be Managed in This Scenario?
For traders considering short positions, the area just above the 1.1491 resistance and the short-term moving averages provides a logical zone to place a stop-loss. This ensures that if the market structure does shift unexpectedly, any potential losses are contained. Before entering any trade, using our Trading Calculator is essential to determine the correct position size that aligns with your stop-loss placement and overall risk management strategy.
Looking ahead, the key question is whether sellers can capitalize on their current control to push the EUR/USD to fresh lows. A failure to do so, and another test of the 1.1491 resistance, might suggest that selling pressure is waning.
Key Takeaways
- Seller Control: Sellers are dominating the EUR/USD, with price being rejected at the key 1.1491 resistance level.
- Moving Average Resistance: The 100 and 200-bar moving averages on the 5-minute chart are acting as a strong dynamic resistance zone.
- Bearish Market Structure: The recent break to new multi-month lows confirms the broader downtrend remains intact.
- Critical Bull/Bear Line: A sustained break back above the 1.1491-1.1500 area is required to shift the short-term bias back to neutral or bullish.
The resistance at 1.1491 on the EUR/USD has proven to be a formidable barrier. What are your thoughts on the primary drivers for the pair as we head into next week? Share your analysis in the comments.
Risk Disclosure: Any opinions, news, research, market analysis, pricing, or other information contained on this website is provided as general market commentary for informational purposes only, and does not constitute investment advice. Aurra Markets shall not accept liability for any loss or damage, including without limitation to, any loss of profit, which may arise directly or indirectly from the use of or reliance on such information.
About Aurra Markets
Retail traders need institutional conditions. Aurra Markets links your MT5 terminal directly to deep liquidity pools. This means you trade with lower spreads and zero requotes. We operate as a pure digital broker with instant USDT deposits.
Access our full asset list at www.aurra.markets.
The Official Aurra Markets:
There is only one Aurra. We are defined by our Double-R spelling and our commitment to transparency. ❌ Not a prop firm. ❌ Not affiliated with Aura Capital. ✅ We are a fully registered International Brokerage (Reg: 2025-00208).