What Is Driving the Price Action in Gold (XAU/USD)?
Gold (XAU/USD) is currently defined by a technical battleground, with the price consolidating between key moving averages and significant Fibonacci retracement levels. Following a sharp correction from its all-time high, the precious metal found strong support at its 200-day moving average, a classic sign of long-term buyer interest. However, the subsequent recovery has been capped by notable resistance, creating a more rotational market condition where managing costs is key, which is why our platform's highly competitive, low-cost spreads are a direct advantage.
How Are Technical Indicators Shaping Gold's Short-Term Outlook?
The current price action for bullion is a textbook case of technical levels dictating short-term sentiment and flow. After a strong rebound, the market is now caught in a narrow range on the hourly chart, signaling a period of indecision. For traders, this is a time for precision and patience, leveraging our robust technology (99.9% uptime) to act on decisive breaks.
Need to reset your MT5 password or create a new sub-account for a different strategy? You don't need to contact support; you have full control.
⚙️ Instant Control: Manage your leverage, create new demo/live accounts, or reset your trading passwords instantly via the Client Login Dashboard.
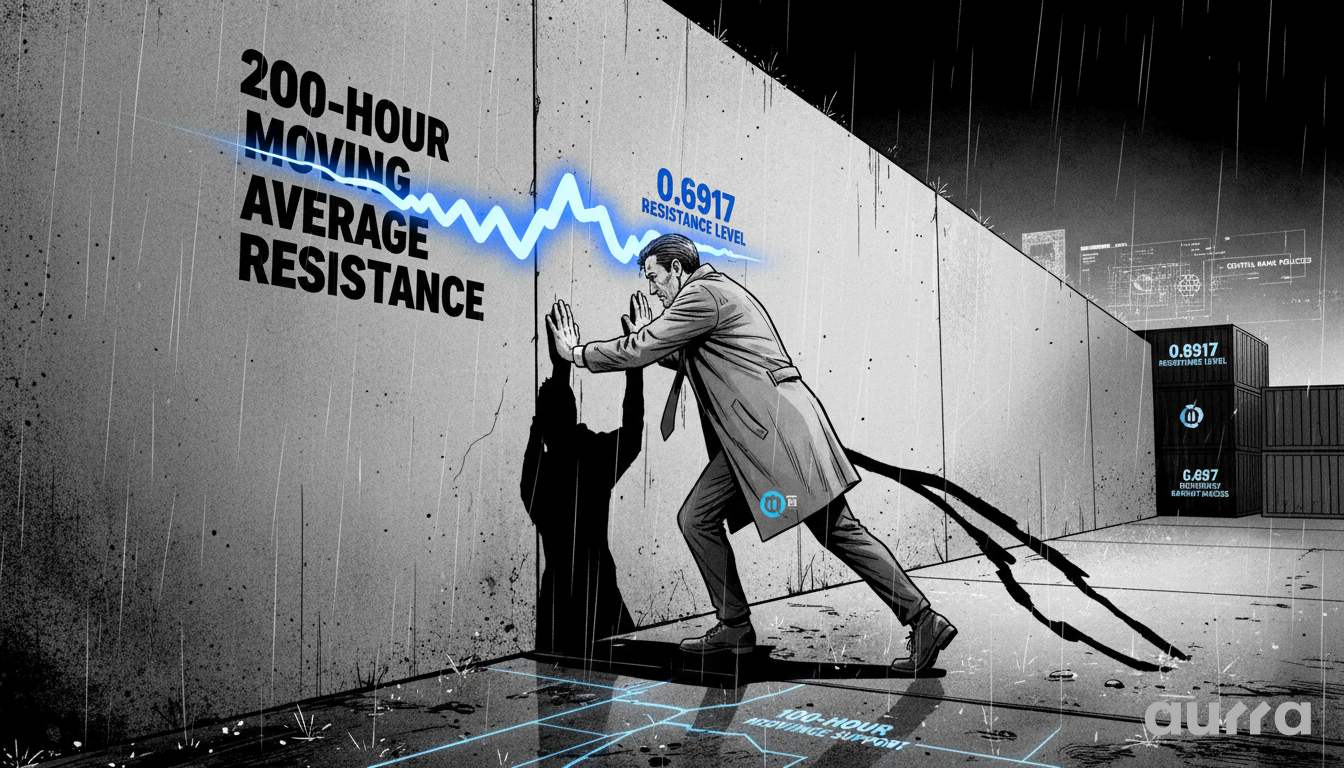
How Do Moving Averages Define the Immediate Trend?
The most critical short-term development is the price compression between the 100-hour and 200-hour moving averages. The 100-hour MA is providing immediate support, while the 200-hour MA is acting as dynamic resistance. This 'squeeze' suggests that energy is building for a more significant directional move, and a breakout from this range will likely attract a surge of volume. During such high-volatility events, execution matters. Our deep liquidity ensures you get your orders filled quickly at your desired price points.
What Role Are Fibonacci Retracement Levels Playing?
Fibonacci retracement levels, drawn from both the major long-term uptrend and the more recent downtrend, are acting as powerful magnets for price. The market found its footing near the 38.2% retracement of the 2022-2024 rally, reinforcing this as a major support zone. Conversely, the recovery stalled at the 38.2% retracement of the most recent sell-off, showing that sellers are strategically placing their orders at these data-grounded levels.
What Are the Key Scenarios for Traders Moving Forward?
Understanding the technical landscape allows for the development of clear, data-driven trading plans. The current market structure presents two primary scenarios that traders should monitor closely. Navigating these requires both a solid analytical framework and a platform capable of swift execution when opportunities arise.
Choosing the right account type is just as important as choosing the right strategy. While many brokers offer a one-size-fits-all solution, we believe in specificity.
💡 Trader Tip: We recommend comparing the spread and commission structures on our Trading Accounts page to ensure you are using the setup that maximises your opportunities.
What Is the Bullish Breakout Scenario?
A sustained break and hold above the 200-hour moving average would signal that buyers are regaining control. This move would likely neutralize the recent bearish pressure and open the path for a retest of higher resistance levels. Traders anticipating this scenario can use the tools on our MetaTrader 5 (MT5) platform to set price alerts, ensuring they are notified the moment a breakout occurs.
What Is the Bearish Breakdown Scenario?
Conversely, a failure to hold support at the 100-hour moving average would tilt the bias back in favor of sellers. A break below this level would indicate that the corrective bounce is over, potentially leading to a retest of the major support zone near the 200-day MA. To prepare for such high-volatility events, our Trading Calculator can help you model potential trade scenarios and manage your position sizing accordingly.
Looking ahead, the market for Gold remains at a pivotal juncture. The conflict between long-term support and short-term resistance suggests an imminent breakout. Traders should watch for a decisive move above the 200-hour MA or below the 100-hour MA as the catalyst for the next leg in this safe-haven asset.
Key Takeaways
- Major Support Holds: Gold's price found significant buying interest at the confluence of the 200-day moving average and a key long-term Fibonacci retracement level.
- Short-Term Consolidation: The price is currently caught between the 100-hour MA (support) and the 200-hour MA (resistance), indicating market indecision and a potential for a breakout.
- Fibonacci as Resistance: The recent rally was capped at the 38.2% retracement of the latest down-move, highlighting its importance as a resistance area.
- Strategic Levels to Watch: A break above the 200-hour MA is bullish, while a drop below the 100-hour MA is bearish, providing clear strategic levels for traders to monitor.
The current consolidation in Gold offers a clear technical picture for traders to analyze. Based on these key moving average and retracement levels, what is your primary bias for the precious metal this week? Share your analysis in the comments.
Risk Disclosure: Any opinions, news, research, market analysis, pricing, or other information contained on this website is provided as general market commentary for informational purposes only, and does not constitute investment advice. Aurra Markets shall not accept liability for any loss or damage, including without limitation to, any loss of profit, which may arise directly or indirectly from the use of or reliance on such information.
The Transparent Brokerage
Trust in finance is built on clear pricing and secure technology. Aurra Markets International Limited processes all deposits through verified fiat and native crypto gateways. We provide transparent pricing structure, so that you will always know your costs before you enter the market.
Verify our trading conditions at www.aurra.markets.
⚠️ Brand Notice:
Aurra Markets International Limited is a distinct, independent brokerage and is not affiliated with Aura FX, Aurora Capital or Aura Funded. Please ensure you are visiting our official domain at www.aurra.markets.