What is Driving the USD/JPY at this Critical Juncture?
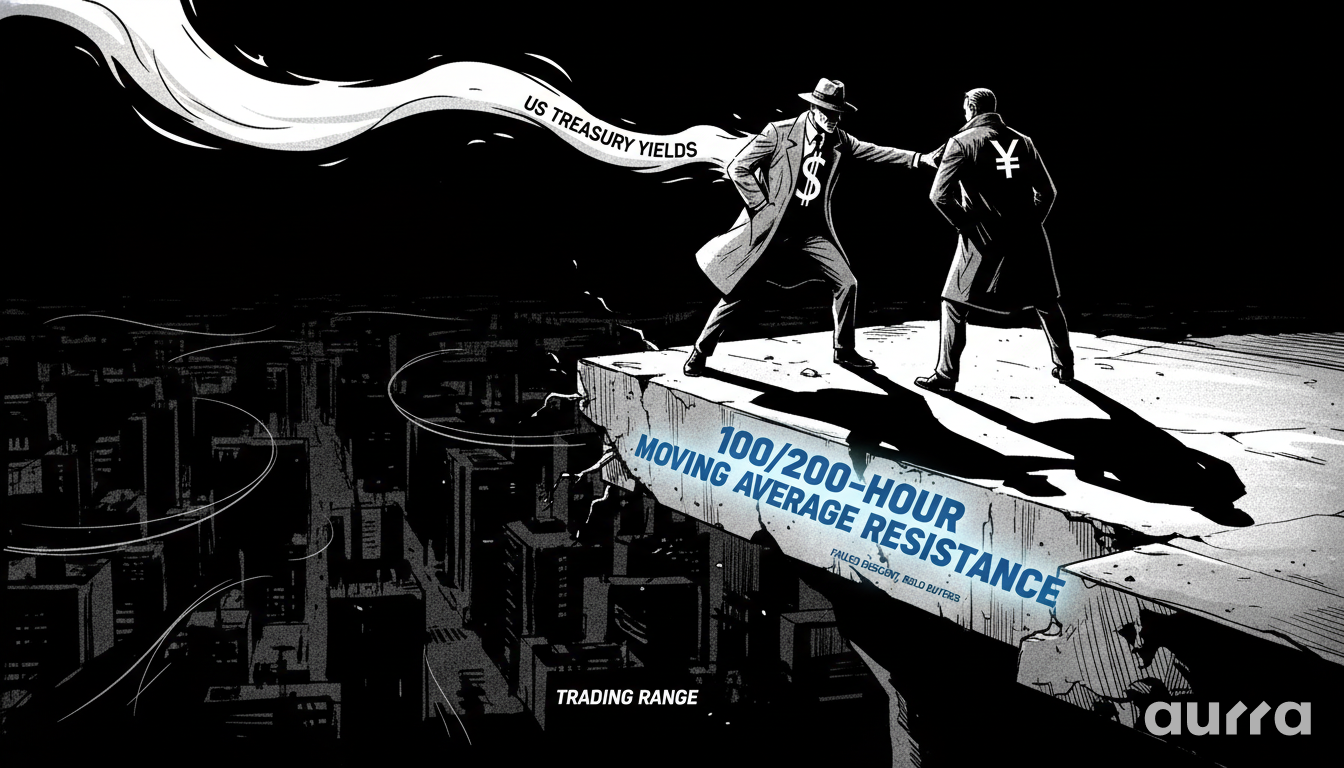
The USD/JPY is currently caught in a technical battle, pushing to new highs for the session as it tests a significant resistance zone formed by the convergence of the 100-hour and 200-hour moving averages. This price action is occurring within a well-established range, supported by a modest rebound in US Treasury yields. The market's inability to sustain a breakdown below key support earlier has emboldened buyers, setting the stage for a classic confrontation between range traders and breakout hopefuls at this technical crossroads.
What is the Significance of the Technical Setup?
Why are the Converged Moving Averages so Important?
The area around 159.23, where the 100-hour and 200-hour moving averages have converged, represents a powerful technical barrier. When major moving averages cluster together, they create a zone that both buyers and sellers watch closely, defining and limiting risk. Because these same levels previously acted as support, their role has now likely flipped to resistance. A failure to break above this area could see sellers re-emerge, while a decisive move through it would signal a significant shift in momentum.
Your account security is just as important as your trading strategy. We recommend regularly updating your password and checking your active sessions to keep your capital safe.
🛡️ Secure Your Access: Ensure your 2FA is active and your profile is up to date. Perform your security check by logging in to the Client Portal.
How Did the Failed Breakdown at 158.00 Influence the Market?
Yesterday's price action saw sellers attempt to push the USD/JPY below the key swing area between 158.01 and 158.26. Although the price briefly dipped to 157.88, the lack of follow-through was a clear signal of seller exhaustion. This failure gave buyers a solid foundation to rebuild from, demonstrating the importance of confirming a breakout before committing to a direction. This is a perfect example of why our Demo account is an invaluable tool for testing strategies around such pivotal levels without risking capital.
What is the Broader Market Context for USD/JPY?
What Defines the Current Trading Range?
For several weeks, the USD/JPY has been largely contained between the 158.00 level on the downside and the 160.00 level on the upside. While there have been minor breaches of these boundaries, the market has consistently reverted to this range. This price behavior creates tight trading ranges. In these conditions, managing costs is key, which is why our platform's highly competitive, low-cost spreads, available on our ECN account, are a direct advantage for active traders.
Timing is everything. Exclusive deposit bonuses and seasonal promotions don't last forever. If you are sitting on the fence, you might be leaving free equity on the table.
🎁 Claim Your Edge: Don't miss out on our latest offers. Secure your eligibility for our current promotions by completing your Sign Up today.
How are US Yields Impacting the Pair?
The modest rise in the 10-year US Treasury yield is providing a gentle tailwind for the USD/JPY. As a yield-sensitive pair, a stronger yield on US debt makes the dollar more attractive relative to the low-yielding Japanese yen. Traders should keep an eye on yield movements as a key indicator of potential direction for the pair. You can use our Trading Calculator to model how changes in the exchange rate might impact your position sizing and risk management.
The USD/JPY is at a critical decision point. Its reaction to the converged moving averages near 159.23 will likely set the tone for the next directional move. A rejection could send the price back toward the 158.00 support, while a sustained breakout would bring the 160.00 range high back into play.
Key Takeaways
- Key Resistance: The USD/JPY is testing a major technical barrier at the converged 100- and 200-hour moving averages near 159.23.
- Defined Range: The pair remains locked in a broader trading range, primarily between 158.00 (support) and 160.00 (resistance).
- Failed Breakdown: The inability of sellers to hold the price below the 158.00-158.26 support zone has shifted momentum back to the buyers.
- Yields Supporting: A slight rebound in US 10-year Treasury yields is providing underlying support for the US dollar.
The USD/JPY is pressing against significant resistance. Do you see this as a setup for a bullish breakout toward 160.00, or is it a bull trap before a reversal back to the 158.00 support level? Let us know your view in the comments.
Risk Disclosure: Any opinions, news, research, market analysis, pricing, or other information contained on this website is provided as general market commentary for informational purposes only, and does not constitute investment advice. Aurra Markets shall not accept liability for any loss or damage, including without limitation to, any loss of profit, which may arise directly or indirectly from the use of or reliance on such information.
About Aurra Markets
Retail traders need institutional conditions. Aurra Markets links your MT5 terminal directly to deep liquidity pools. This means you trade with lower spreads and zero requotes. We operate as a pure digital broker with instant USDT deposits.
Access our full asset list at www.aurra.markets.
The Official Aurra Markets:
There is only one Aurra. We are defined by our Double-R spelling and our commitment to transparency. ❌ Not a prop firm. ❌ Not affiliated with Aura Capital. ✅ We are a fully registered International Brokerage (Reg: 2025-00208).