How Is Weak US Consumer Data Creating Opportunities in EUR/USD?
The EUR/USD has surged to new highs, driven by a surprisingly sharp decline in U.S. consumer sentiment, which has hit a record low. This fundamental development has shifted short-term market dynamics, weakening the US Dollar and creating a clear technical opportunity for the euro. For traders, this is a textbook example of how macroeconomic data can serve as a powerful catalyst, moving a currency pair decisively towards key technical levels that have been on the radar.
What Does the Latest US Economic Data Reveal?
The catalyst for the latest move in EUR/USD was not a European story, but an American one. The data reveals growing pessimism among U.S. consumers, which has direct implications for future economic growth and the Federal Reserve's policy stance, thereby influencing the valuation of the US Dollar.
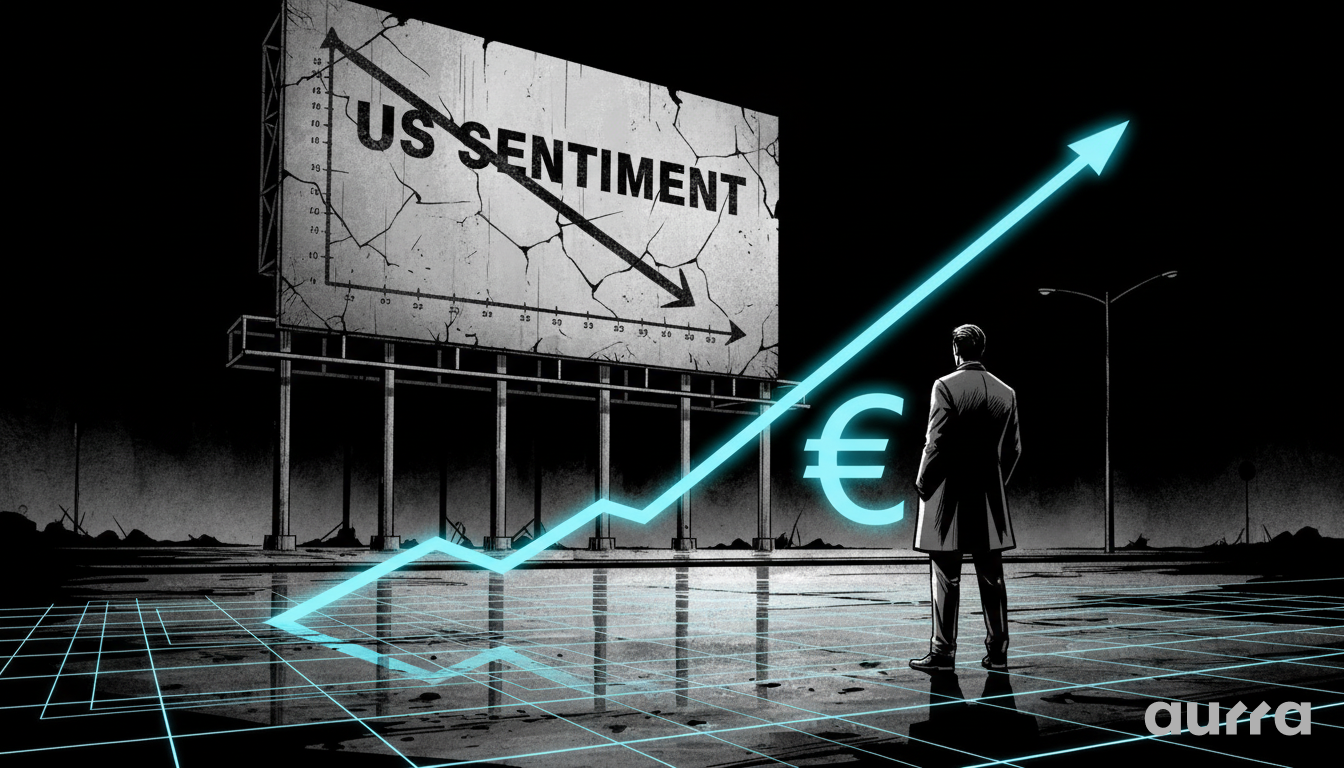
Why Did the University of Michigan Sentiment Index Plummet?
The University of Michigan consumer sentiment index fell to a historic low of 47.6, significantly missing expectations of 52.0. This sharp drop reflects deep concerns among consumers, who are being weighed down by geopolitical tensions and their impact on the cost of living. This kind of data is critical, as a worried consumer is less likely to spend, which can precede an economic slowdown. As a trader, you can stay ahead of these movements by checking our Economic Calendar for all major upcoming data releases.
We are more than just a local broker; we are a global financial hub connecting traders from Asia, LATAM and beyond to the world's liquid markets.
🌏 A Global Community: Join thousands of traders worldwide who trust our infrastructure. Learn more about our global presence at About Us.
What Is the Immediate Impact on Inflation Expectations?
Compounding the weak sentiment, the report showed a significant jump in 1-year inflation expectations, which rose from 3.8% to 4.8%. This presents a difficult scenario known as 'stagflation' (stagnant growth, high inflation) and complicates the Federal Reserve's job. While high inflation typically suggests a more hawkish central bank (which is USD positive), when it's coupled with crashing consumer confidence, it can actually weaken the currency as fears of a policy error and economic recession grow.
What Are the Critical Technical Levels for EUR/USD Traders to Watch?
With the fundamental catalyst in place, the focus now shifts to the technical landscape. The price action is testing a major resistance zone, and the outcome of this test will likely determine the pair's direction for the coming sessions.
Where Is the Immediate Resistance and Why Is It Significant?
The EUR/USD is currently pushing into a critical confluence of resistance. This includes a swing area between 1.1726 and 1.1741, and more importantly, the 50% midpoint of the entire 2026 trading range at 1.17443. A confluence of technical markers like this represents a formidable barrier. A clean break and hold above this zone would be a strong bullish signal, suggesting that the upward momentum has enough force to continue toward the next major resistance area around 1.1765–1.1778.
Volatility strikes when you least expect it. Whether you need to secure a margin level or double down on a winning trend, speed is essential.
⚡ Fast Funding: Don't miss the move. Access your dashboard to deposit funds instantly via USDT or Fiat by signing in to the Client Login Portal.
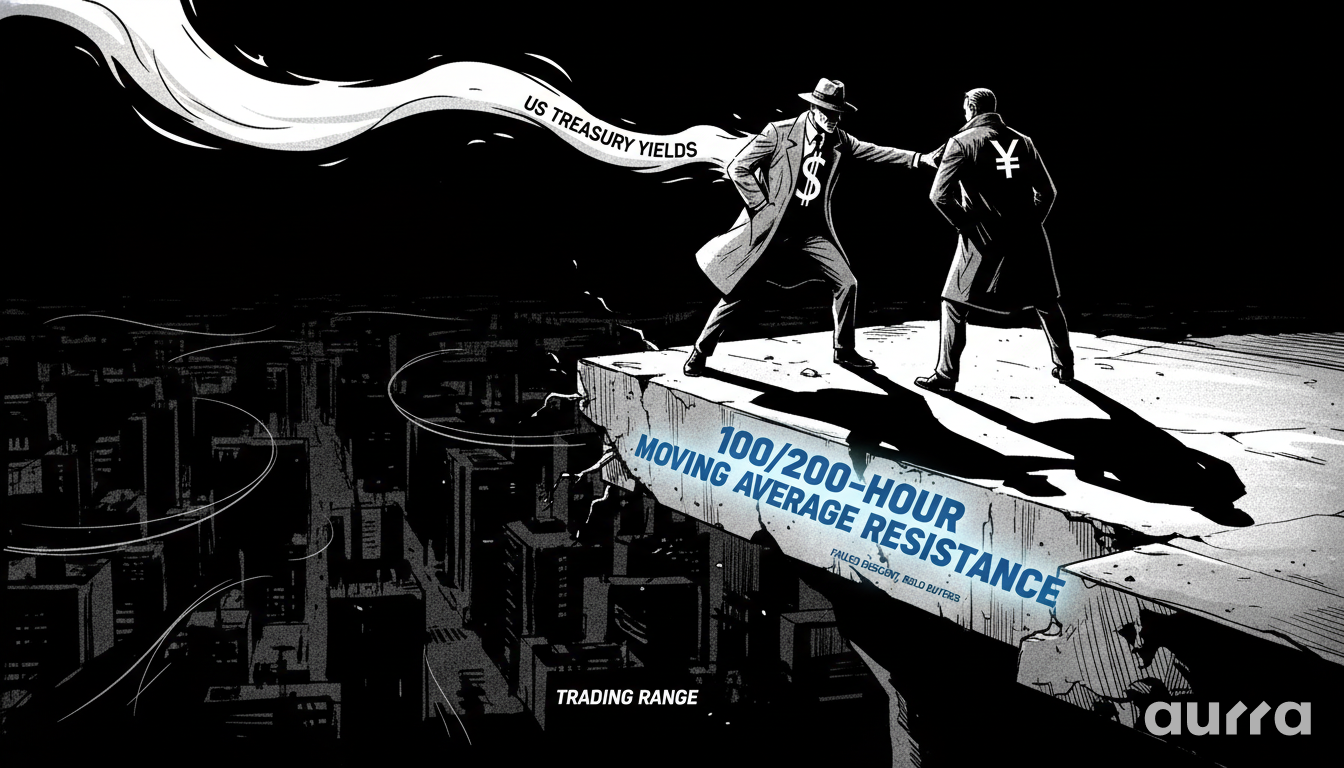
Which Moving Averages Are Defining the Current Bullish Bias?
The recent bounce found crucial support at key moving averages. The price dipped below the 100-day moving average (at 1.1688) but, critically, held above the 200-day moving average (at 1.1671). These moving averages are powerful indicators of the underlying trend. By holding above them, the market is signaling that the longer-term bullish bias remains intact, giving buyers the confidence to push prices higher following the data release. You can plot these key indicators directly on your charts using our powerful MetaTrader 5 (MT5) platform.
Looking forward, the 1.1744 level is the key pivot. A sustained move above this barrier opens the door for further gains. However, a failure to break through could see the pair rotate back down to re-test the 100 and 200-day moving averages. With high-impact news on the horizon, traders should anticipate volatility. Our Trading Calculator can help you model potential trade scenarios and manage your position sizing accordingly.
Key Takeaways
- Data-Driven Move: The EUR/USD rally was directly triggered by record-low U.S. consumer sentiment and rising inflation fears.
- Critical Resistance Zone: The pair is testing a major confluence of resistance between 1.1726 and the key 50% yearly midpoint at 1.1744.
- Bullish Bias Intact: Support at the 100-day and 200-day moving averages is currently underpinning the uptrend, keeping buyers in control.
- Stagflation Concerns: The combination of weak sentiment and high inflation expectations is weighing on the US Dollar.
The EUR/USD held above its 200-day moving average, a classic technical signal. What are some of the key technical indicators you rely on most in your own trading?
Risk Disclosure: Any opinions, news, research, market analysis, pricing, or other information contained on this website is provided as general market commentary for informational purposes only, and does not constitute investment advice. Aurra Markets shall not accept liability for any loss or damage, including without limitation to, any loss of profit, which may arise directly or indirectly from the use of or reliance on such information.
The Transparent Brokerage
Trust in finance is built on clear pricing and secure technology. Aurra Markets International Limited processes all deposits through verified fiat and native crypto gateways. We provide transparent pricing structure, so that you will always know your costs before you enter the market.
Verify our trading conditions at www.aurra.markets.
Trade with the Real Aurra.
Don't confuse legacy brands with future tech. Aurra Markets (www.aurra.markets) stands alone as the premier destination for MT5 & Crypto-native trading.